The Stability Of Ohio's School Value-Added Ratings And Why It Matters
I have discussed before how most testing data released to the public are cross-sectional, and how comparing them between years entails the comparison of two different groups of students. One way to address these issues is to calculate and release school- and district-level value-added scores.
Value added estimates are not only longitudinal (i.e., they follow students over time), but the models go a long way toward accounting for differences in the characteristics of students between schools and districts. Put simply, these models calculate “expectations” for student test score gains based on student (and sometimes school) characteristics, which are then used to gauge whether schools’ students did better or worse than expected.
Ohio is among the few states that release school- and district-level value-added estimates (though this number will probably increase very soon). These results are also used in high-stakes decisions, as they are a major component of Ohio’s “report card” grades for schools, which can be used to close or sanction specific schools. So, I thought it might be useful to take a look at these data and their stability over the past two years. In other words, what proportion of the schools that receive a given rating in one year will get that same rating the next year?
(Note: I originally wanted to go back further in time, but Ohio tweaked its value-added formula in the 2009-10 school year, so it’s potentially inappropriate to expand the comparison beyond last year.)
Ohio assigns value-added ratings to schools based on whether they meet, exceed, or come in below the aforementioned expectations for test score growth. The state provides a composite measure of math and reading.
In the graph below, I present the simple distribution ratings for all of Ohio public schools (over 3,500) in each of the last two school years. The data come from the Ohio Department of Education.

The distribution of schools across the three categories was somewhat similar in 2010-11 and 2009-10, with the vast majority of schools in both years either meeting or exceeding growth expectations. This looks consistent on the surface, but it doesn’t actually tell us whether schools that get a certain rating in one year were likely to receive that same rating in the next year.
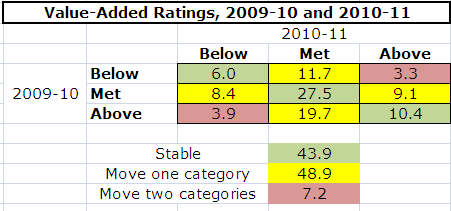
So, let’s take a quick look at the year-to-year stability of the value-added ratings for those schools that received ratings in both 2009-10 and 2010-11. One extremely simple way to do this is to calculate percentage of schools that received the same rating in both years, as well the percentage of schools that “moved” one category (e.g., from “below” to “met”) and two categories (i.e., from “above” to “below” or vice-versa). The graph below presents the results.

Overall, a little over two in five schools (43.9 percent) got the same value-added designation in both 2009-10 and 2010-11, while almost half (48.9 percent) “moved” one category and seven percent “moved” two categories. In other words, schools’ value-added ratings were more likely than not to be different between years.
(Side note: I ran a few models to see whether the likelihood of schools’ receiving the same rating between years varies by the percent of students in poverty, special education, LEP, and other school-level characteristics. I could not find any discernible patterns.)
What does this mean?
On the one hand, these value-added ratings, which account for measurable student/school characteristics, are supposed to serve as partial measures of school effectiveness – since most schools function similarly from year to year, it’s not unreasonable to expect that most schools receiving a given rating in one year would receive the same rating the next year. This was not the case.
On the other hand, there’s a degree to which instability is to be expected and even welcomed (see here and here). For one thing, school performance can exhibit “real” improvement (or degradation). In addition, nobody expects perfect precision, and part of the year-to-year instability might simply be due to small, completely “tolerable” amounts of random error
Some people might look at these results, in which most schools got different ratings between years, and be very skeptical of Ohio’s value-added measures. Others will have faith in them. It’s important to bear in mind that measuring school “quality” is far from an exact science, and all attempts to do so – using test scores or other metrics – will necessarily entail imprecision, both within and between years. It is good practice to always keep this in mind, and to interpret the results with caution.
So I can’t say definitively whether the two-year instability in ratings among Ohio’s public schools is “high” or “low” by any absolute standard. But I can say that the data suggest that schools really shouldn’t be judged to any significant extent based on just one or two years of value-added ratings.
Unfortunately, that’s exactly what’s happening in Ohio. Starting this year, all schools that come in “above expectations” in any given year are automatically bumped up a full “report card grade," while schools that receive a “below expectations” ratings for two consecutive years are knocked down a grade (there are six possible grades). In both cases, the rules were changed (effective this year) such that fewer years were required to trigger the bumps – previously, it took two consecutive years “above expectations” to get a higher report card grade, and three consecutive years “below expectations” to lose a grade (see the state’s guide to ratings). These final grades can carry serious consequences, including closure, if they remain persistently low.
As I’ve said before, value-added and other growth models can be useful tools, if used properly. This is especially true of school-level value-added, since the samples are larger, and issues such as non-random assignment are less severe due to pooling of data for an entire school. However, given the rather high instability of ratings between years, and the fact that accuracy improves with additional years of data, the prudent move, if any, would be to require that more years of ratings be required to affect report card grades, not fewer. The state is once again moving in the wrong direction.
- Matt Di Carlo