The Story Behind The Story: Social Capital And The Vista Unified School District
Our guest author today is Devin Vodicka, superintendent of Vista Unified, a California school district serving over 22,000 students that was recently accepted into the League of Innovative Schools. Dr. Vodicka participates in numerous state and national leadership groups, including the Superintendents Technical Working Group of the U.S. Education Department .
Transforming a school district is challenging and complex work, often requiring shifts in paradigms, historical perspective, and maintaining or improving performance. Here, I’d like to share how we approached change at Vista Unified School District (VUSD) and to describe the significant transformation we’ve been undergoing, driven by data, focused on relationships, and based in deep partnerships. Although Vista has been hard at work over many years, this particular chapter starts in July of 2012 when I was hired.
When I became superintendent, the district was facing numerous challenges: Declining enrollment, financial difficulties, strained labor relations, significant turnover in the management ranks, and unresolved lawsuits were all areas in need of attention. The school board charged me and my team with transforming the district, which serves large numbers of linguistically, culturally, and economically diverse students. While there is still significant room for improvement, much has changed in the past three years, generally trending in a positive direction. Below is the story of how we did it.
In the past three years, we have been engaged in a process of strategic planning that intentionally involved district and community stakeholders. To develop a culture that supports a high level of performance requires a focus on both people and processes. Change should begin with a thorough understanding of how well or poorly individuals work together, and then move on to process improvement. In this paradigm, it is people first and process second, but both are crucial. This focus has resulted in a dynamic plan, built on jointly agreed upon core values such as respect, trust, and collaboration, all of which have been central to our work. In addition, we have worked with all district and site leaders, with a focus on creating a highly collaborative, networked, and data-driven culture of learners.
Vista Unified recently received recognition for being a model of educational excellence and innovation, particularly with respect digital learning. For example, we were one of four districts which were highlighted by the Alliance for Excellent Education during Digital Learning Day in March of 2015. We were accepted into the prestigious League of Innovative Schools and have two of the first Digital Promise Schools in the nation. I have been invited to the White House four times in the past year, and had the opportunity to meet with President Obama in November of 2014 at the ConnectED to the Future Convening.
But while much of the recognition for innovation has been focused on technology, the “story behind the story” begins with a focus on the values we have established together: Respect, trust, and collaboration. In partnership with Alan J. Daly and his team from the University of California San Diego (UCSD), we have undertaken an empirical approach, based on organizational network mapping, to build the district’s relational capacities. Accordingly, we routinely collect data from our leadership team on the actualization of our values and the development of social networks. In addition, we have worked across the district collecting a host of measures to assess the relational capacity and climate of all of Vista stakeholders (e.g., students, parents, teachers, and classified staff). This rich data set includes: longitudinal social network data, climate and culture surveys, and measures of efficacy, impact, and resources related to the Common Core State Standards (CCSS). Our end goal was to collect information that could help us improve the “social capital” of the district.
I first became aware of the significant potential of a focus on social capital about ten years ago, while working on my dissertation as part of a research study with SRI International. Recent research, some of which has been highlighted through this blog’s Social Side of Education series (see here, here and here, for example), underscores the importance of social capital in educational change. Social capital refers to the benefits that emerge as resources and expertise are exchanged through relationships. The level of social capital of a group or system can be measured and analyzed through social network analysis, which includes the use of social maps called “sociograms,” to help visualize the patterns of interactions between people as well as a set of metrics to help quantify improvement. These metrics may include “density,” which is a ratio of existing ties to possible ties, “degree,” which denotes the average number of individuals an actor is connected to for the relation, and “reciprocity,” the percentage of mutual ties. These measures enable us to track progress over time.
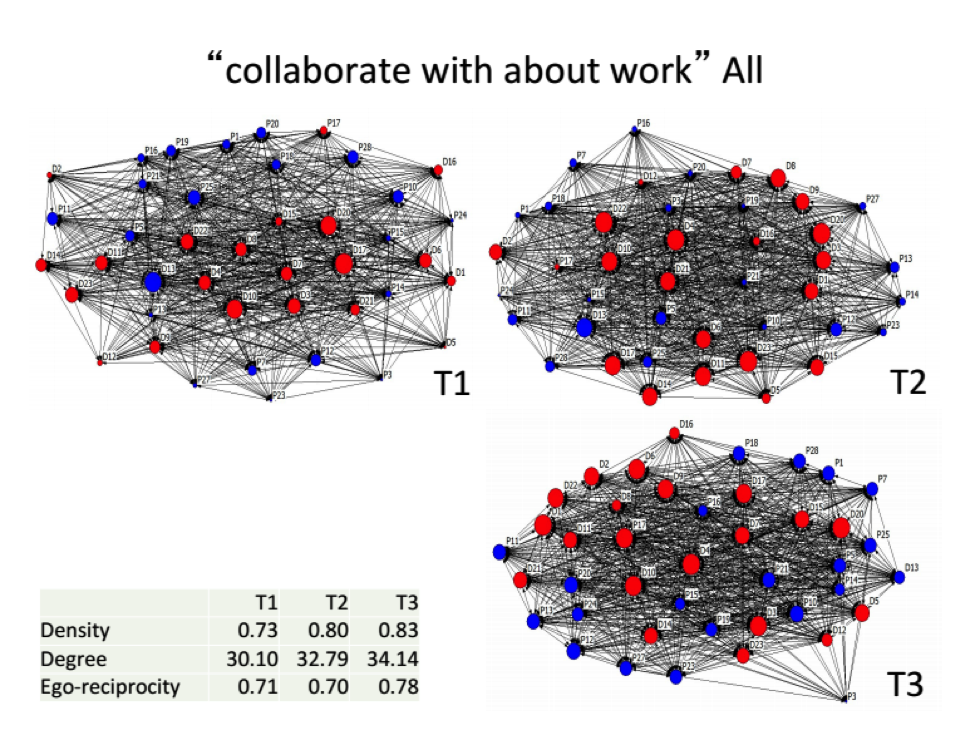
Through the partnership with UCSD, we began to reflect on and analyze our organizational network maps representing our own patterns of interaction. For example, consider the changes that are shown in Figure 1, where each circle represents a member of our leadership team (red are people with central office roles, blue are school site leaders) and each line represent the presence of a relationship between two people. At Time 1 (T1), we were struck by how many people who were central in the network (red circles) were from the central district office. Based on this information, we deliberately set about to promote more cross-functional efforts and to reduce reliance on the district office personnel as a conduit for information. While this is still a work in progress, the most recent network data (T3) show an increasing number of site leaders (blue circles) in prominent (i.e., more central) roles in the network. In addition, we recognize and celebrate the fact that there have been overall improvements in the levels of connectedness and collaboration (i.e., from .73 to .83).
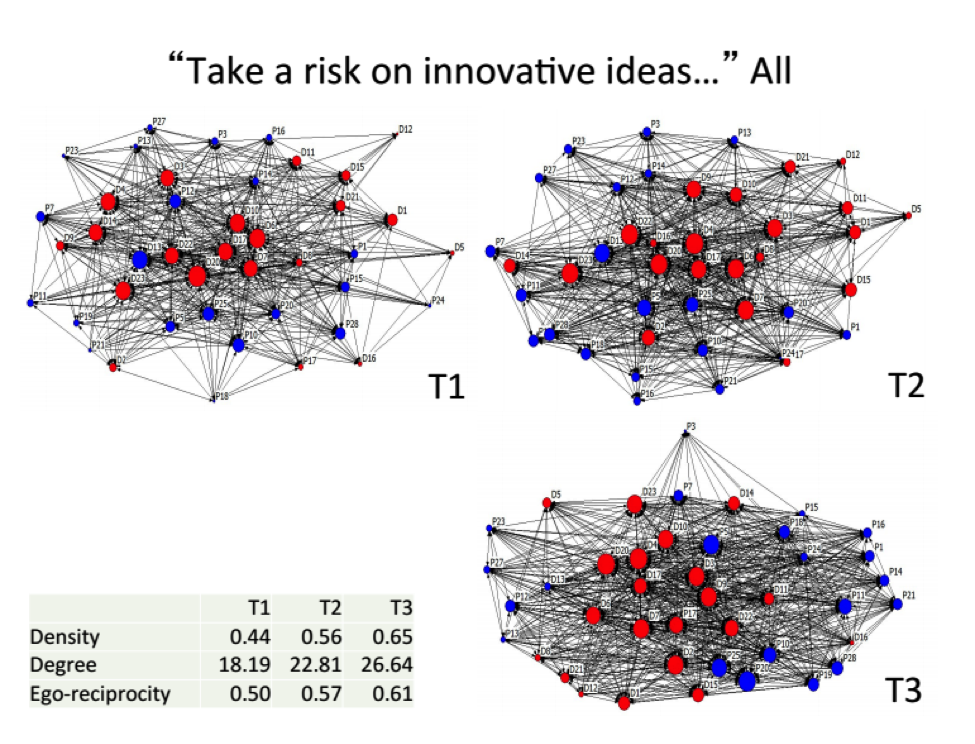
Through these network maps, we see similar improvements in many areas. For example, the figure below represents perceptions about who is willing to take a risk on innovative ideas. In this network map, we see overall increases in willingness to take risks and more district office leaders becoming more central in this network. We have committed ourselves to doing this work with high engagement over time and continue to collect data about our networks, regularly incorporating that data into our discussions and practice.
The key to all this is that, by reflecting on the patterns that are made clear with these network maps or sociograms, we can take a data-informed approach to refining and adjusting our communication and collaboration systems.
My own dissertation research made it clear that diffusion of innovation is accelerated or impeded by the degree of social connection within a given setting. This is one of the reasons that programs can be a huge success in one environment but inconsequential in another. Often, it is the underlying social structures that are predictive of the depth and speed of change. I was excited about the evident improvements in our interactions long before we began to receive such positive attention from outside the school district.
Based on research by myself and others, as well as the experiences described above, I credit our improvement to our focus on the relational aspects of our work and on our ability to draw on the collective wisdom of all Vista shareholders. For example, when it was clear that there was an absence of positive recognition in our environment, we added a “compliments” section to the beginning of each leadership team meeting to showcase excellence and effort. We shifted our agendas to provide for time more unstructured interactions and brought food into the meetings. We also developed cross-functional “networks” of leadership teams to work on shared challenges and share successes. While some of these may seem like trivial adjustments, ongoing attention to and willingness to act upon the feedback from the group has enhanced the system’s overall level of trust and helped to improve relationships and connectedness, thereby strengthening the system’s social capital.
Vista’s focus on relationships has not received much external attention, and yet it is this “story behind the story” that I believe other leaders will find valuable to their improvement efforts. This is not easy work – the dynamic complexity of any single relationship is multiplied when considering network effects – but, based on my experience, my research, and the research of others, I believe that this approach is essential for successful, deep and lasting change.