What Are "Middle Class Schools"?
An organization called “The Third Way” released a report last week, in which they present descriptive data on what they call “middle class schools." The primary conclusion of their analysis is that “middle class schools” aren’t “making the grade," and that they are “falling short on their most basic 21st century mission: To prepare kids to get a college degree." They also argue that “middle class schools” are largely ignored in our debate and policymaking, and we need a “second phase of school reform” in order to address this deficit.
The Wall Street Journal swallowed the report whole, running a story presenting Third Way’s findings under the headline “Middle class schools fail to make the grade."
To be clear, I think that our education policy debates do focus on lower-income schools to a degree that sometimes ignores those closer to the middle of the distribution. So, it’s definitely worthwhile to take a look at “middle class schools’” performance and how it can be improved. In other words, I’m very receptive to the underlying purpose of the report.
That said, this analysis consists mostly of arbitrary measurement and flawed, vague interpretations. As a result, it actually offers little meaningful insight.
The measurement issue pretty much sinks the analysis by itself. If the entire focus of your report is on presenting findings about “middle class schools," then how you define that term is the most important analytical decision. The authors of this report impose what appears to be a completely arbitrary class structure on U.S. schools, calling them “middle class” when they have between 26-75 percent free/reduced price lunch (FRL) students.
The Third Way report’s authors spend only two sentences justifying their choice (in the appendix). They offer the caveat that some of their “middle class schools” share characteristics with their “lower class schools," and then, without any elaboration, simply state, “for our purposes, we think that defining middle class schools as those with 26% to 75% NSLP [free/reduced lunch] eligibility is the most accurate description of schools in the middle."
Making things even worse, one of the report’s three “key findings” is that “most students [53 percent] are in middle class public schools." In other words, they choose their own definition of “middle class schools," without even defending that choice or testing alternatives, and then report total proportional enrollment in those schools as if it’s a fact.
Class is a social construct. When you choose to measure it in terms of income (which is what the Third Way report does, using free/reduced lunch eligibility as a proxy), you are defining classes in relative terms. People’s incomes are in the “middle” insofar as there are some people above them and some below them. Where the “middle class” begins and ends on this continuum is open to interpretation.
Schools in all three of Third Way’s groups contain students from families with many different incomes, and free/reduced-price lunch eligibility rates are limited in their ability to capture this. As stated above, I don’t have a problem with seeing how performance and other outcomes differ across schools with varying proportions of low-income students. But it should be done thoughtfully.
A more revealing analysis, preferably one using a few simple statistical models, would have presented results across the entire distribution of FRL eligibility, not just three categories. It would have included results separated by subgroup – for example, how do low-income students perform in schools that are largely low-income versus more affluent schools? The meat of their discussion should have been a focus on performance toward the middle part of the distribution, and whether/how it differs from higher- and lower-income schools in terms of factors such as student subgroup and location. As a supplemental presentation of results, it certainly might have been useful to provide averages for a couple of different definitions of what constitutes the “middle class," in order to give readers a few summary statistics to hold on to.
Instead, the Third Way authors kind of skipped right to the media-friendly supplemental part. They ignored the distribution of school-level poverty by covering it up with random categories. As a result, their findings, as presented, aren’t very helpful.
Let’s briefly illustrate how, using the same data as those used by the Third Way report (which come from the National Center for Education Statistics and the New America Foundation). Take a look at the distribution of enrollment (the percent of students in each category) by FRL eligibility.

The bars shaded in blue are those labeled “middle class” by the Third Way report. You can see that enrollment is not equally distributed across FRL categories. There are more students in the “upper class” schools (those with lower poverty, the five red bars on the left) than in the “lower class” schools (the five red bars on the right). Put differently, the distribution of schools labeled “middle class” is skewed toward one side of the FRL continuum.
So, while the authors claim to be examining “schools in the middle," what they’re really looking at is the percentages that are in the middle (26-75 percent FRL), and which schools happen to fall into them. At the very least, they should have sorted schools into FRL quartiles - for example, the "upper class" would be comprised of the 25 percent of schools with the lowest poverty, rather than the group of schools that happen to have FRL rates under 25 percent (using this definition, about 15 percent of schools in their analysis would be classified differently).
Even if they had done so, however, it’s difficult to know what the overall averages for this massive group really mean – do they really reflect any conceivable definition of “middle class schools”?
Using FRL rates as a proxy for income is certainly the most convenient choice for a large, school-level analysis, but it only tells you the proportion of students whose incomes are below a certain line – the free/reduced-price lunch eligibility line. It doesn’t tell you anything about the size of the income differences, both within and between schools.
This “loss of data” is particularly acute when, as in this report, you combine free and reduced lunch eligibility, instead of separating them out, which permits isolation of students below the poverty line and those with incomes 100-130 percent of the poverty line. When you combine both categories, it means that two schools might have similar free/reduced lunch eligibility rates, but one could have a much larger proportion of free lunch students, which indicates that more of its students are actually below the poverty line.
On a related note, it’s important to look at how the definition of “middle class” squares with income (the income data used by Third Way are only available at the district-level, which, by the way, means the report is comparing a different set of schools as "middle class" in these tabulations). The Third Way authors did report average median incomes for each of their three “classes," but didn’t examine how income varies within those classes. Let’s see what that looks like.
The graph below presents median family income by school-level FRL category (again, the blue bars are those called “middle class” in the report).

As the Third Way folks point out in their appendix, a fairly large proportion of districts in the “middle class” brackets have median incomes that are not particularly different from those in the 75-90 percent FRL brackets. For example, families in districts with 60-65 percent FRL rates (toward the middle of the blue “middle class schools” group) are only a few thousand dollars less than those in districts with 85-90 percent rates (the middle of the red “lower class” schools). But they’re compared in the report as belonging to different classes.
That’s one of the problems with setting arbitrary absolute definitions of classes and not presenting results across the whole distribution – you’re differentiating without much of a difference.
I’d also like to comment quickly on the report’s conclusions about the performance of “middle class schools." They offer two sets of key findings here. The first is about “inputs” - that “middle class schools” spend the least per-pupil, their teachers earn the lowest salaries and they have the highest student-per-teacher ratios. I suppose these are all fine to point out, even though the funding is to a degree a function of federal/state aid, much of which is specifically targeted to higher-poverty schools/districts, while the differences in teachers’ salaries are in no small part a result of the fact that higher-poverty schools are often located in urban areas, which have a higher cost of living.
Their second, more important set of key findings is about outputs, or performance. They find that “middle class” students have low proficiency rates (between 28-36 percent, depending on the grade/subject) on the National Assessment of Educational Progress (NAEP), only 38 percent go on to college immediately after graduation and a mere 28 percent graduate from a four-year institution by the time they’re 26 years old.
It’s more than a little strange for Third Way to categorize schools using an income-based measure, find that performance varies by income category, and then argue that it’s the schools that are “falling short” and “not making the grade." That may be true to some extent, and in some cases, but education doesn't occur in a vacuum.
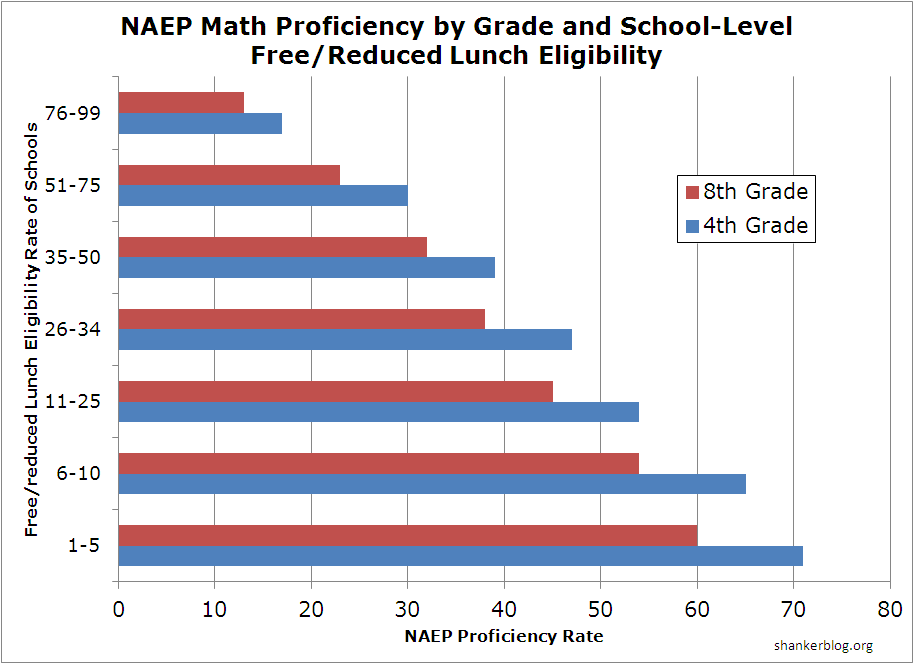
Take a look at 2009 NAEP math proficiency rates across the varies categories of school-level FRL eligibility (the categories below are the most detailed provided by NAEP).

As is almost always the case, the higher the school poverty rate, the lower the proficiency rate (results are very similar for reading). The Third Way’s results demonstrate (albeit very poorly, using large, arbitrary categories) the strong relationship between school-level income and test performance, but what they seem to argue is that the “underwhelming” performance is due to the fact that “middle class schools” aren’t “making the grade."
To be fair, sometimes the report’s authors characterize the results in terms of low performance among “middle class students," while at other times, including the title, they say it’s the schools that are doing poorly. In other words, they seem to be conflating the performance of “middle class” students and schools, and it’s an important distinction. The former is a description – it simply states that students aren’t scoring highly (at least by the authors' standards). The latter is a causal argument – students aren’t scoring highly because the schools are failing them.
Unfortunately, the measures and methods in this report are not appropriate for either purpose. If you’re arguing that middle-income students are underperforming, you should present test scores by the income/poverty status of students, not schools (or, preferably, examine the former while controlling for the latter, among other things). If you want to show that the middle-income schools are underperforming, you need to account for differences between them in terms of resources, student characteristics and other factors.
In short, it’s not clear what this report's authors are trying to show, but it’s clear they didn’t show it.
All of these same basic issues apply to their findings about graduation rates, but there’s the additional twist of cost. Higher education is remarkably expensive, well out of reach for most families. The fact that only a minority of students in “middle class schools” attend and complete college is in large part a function of costs – and the debt students must incur in order to pay them – rather than of school quality or student performance. The report ignores this completely.
So, overall, I think it’s a good idea for policy analysts and advocates to expand our focus beyond the low-income districts that get so much of the attention. And I think that reports that focus on some more nuanced version of the “middle class schools” concept can be a useful foray into this infrequently-traversed territory.
Frankly, however, Third Way’s effort, while well-intentioned, almost obscures more than it reveals. That’s not how to get a productive conversation started.
Maybe we need a fourth way.
- Matt Di Carlo