In Ohio, Charter School Expansion By Income, Not Performance
For over a decade, Ohio law has dictated where charter schools can open. Expansion was unlimited in Lucas County (the “pilot district” for charters) and in the “Ohio 8” urban districts (Akron, Canton, Cincinnati, Cleveland, Columbus, Dayton, Toledo, and Youngstown). But, in any given year, charters could open up in any other district that was classified as a “challenged district," as measured by whether the district received a state “report card” rating of “academic watch” or “academic emergency." This is a performance-based standard.
Under this system, there was of course very rapid charter proliferation in Lucas County and the “Ohio 8” districts. Only a small number of other districts (around 20-30 per year) “met” the performance-based standard. As a whole, the state’s current charter law was supposed to “open up” districts for charter schools when the districts are not doing well.
Starting next year, the state is adding a fourth criterion: Any district with a “performance index” in the bottom five percent for the state will also be open for charter expansion. Although this may seem like a logical addition, in reality, the change offends basic principles of both fairness and educational measurement.
Let me explain. The state’s performance index is calculated using the percentage of students whose test scores fall into the categories of limited, basic, proficient, accelerated, and advanced. The formula appears almost completely arbitrary. For example, students who score “advanced” on an exam are “valued” twice as highly as students who score “basic," and four times as highly as those falling into the “limited” category. I’m not aware of any justification for making assumptions about the “value” of any category relative to the other categories. There are far more rigorous means of calculating overall performance indexes.
But, even if the formula was more defensible, the biggest problem with using the index is that it is not a particularly useful performance measure.
One of the more positive developments in education policy over the past 5-10 years is an increased focus on growth, rather than absolute performance level. Put simply, it’s not how high you score, but how much progress your students have made. Schools or districts that generate large testing gains are considered effective, even if their overall scores remain low. Thus, some high-poverty schools and charters, such as KIPP, are widely acknowledged to be good schools, even though their students continue to test lower than their peers in affluent districts.
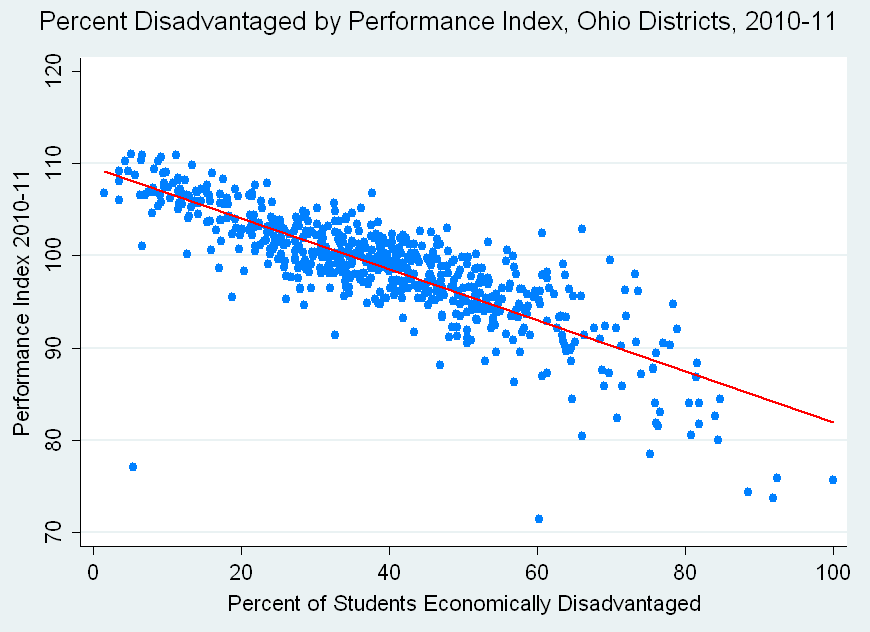
One of the reasons for judging schools by students’ growth, rather than their absolute performance, is that the latter is more a function of social and economic forces than anything else. In the graph below, using data from the Ohio Department of Education, I plot the relationship between the Ohio performance index and the percent of each district’s students who are low-income (“economically disadvantaged”). Each dot represents a district, and the red line represents the average relationship between the two variables (note that the vertical axis begins at 70).

This is a rather strong relationship. With very few exceptions, the districts with the highest poverty rates score 25-35 points below the districts with the lowest poverty rates. The correlation coefficient, which ranges from zero to 1 (with zero representing no relationship and one representing a perfect relationship), is -0.83, which is very high.
The new law basically guarantees that almost all of the districts that will become eligible for charter expansion every year will be high-poverty. Most will also have unusually high proportions of special education, LEP, and minority students. But they won’t all be “low-performing” - at least not by the widely-accepted growth-based standard of performance.
To illustrate this, I took a look at the value-added outcomes for those schools that fall into the bottom five percent on this year’s performance index (I excluded Lucas County and the “Ohio 8," since they’re always eligible). There were 23 districts in this bottom tier. But, based on the state’s value-added model, 11 of the 23 either met or exceeded expectations. This means they either performed up to par, or better. Nevertheless, the new Ohio law will target them for charter expansion based on their “low performance."
This is a problem. The state’s criteria are based explicitly on performance - low-performing districts are supposed to be opened to charter competition because they are low-performing. But in fact, the new law pretty much ensures that charter expansion will occur more because of poverty than because of actual performance. This not only violates the spirit of the law, but it’s also bad policy, as it risks upheaval in districts that are actually doing well by the more widely-accepted growth-based standard.
Finally, it’s worth noting that there is extreme irony in basing decisions about charter expansion solely on how districts score on the performance index. Here’s why: In a previous post, I presented a mini-analysis of charter versus regular public school performance in the “Ohio 8” districts, in which one in five students attends a charter school. One of the findings from that brief analysis was that, controlling for student characteristics, the charters tend to receive lower performance index scores by educationally meaningful and statistically significant margins. In other words, the solution for districts with low index scores is to open up more charter schools, which, where they have been permitted to expand, have relatively low index scores.
- Matt Di Carlo

Good data! I would love to know who the outliers are. Especially that school in the lower left corner!