The Progressive School Funding Option
One of the more striking findings in our recent report presenting data from the School Finance Indicators Database concerns funding progressivity, or fairness. A state’s finance system is considered progressive (or fair) to the degree districts serving higher-needs students (e.g., lower-income students) receive more funding than districts serving lower-needs students.
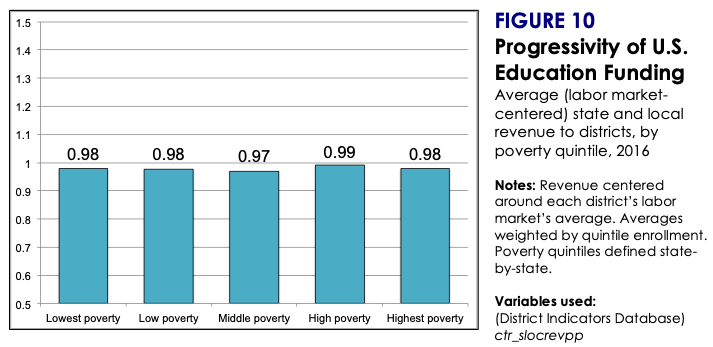
The graph below is taken directly from our report (my co-authors are Bruce Baker and Mark Weber), and it provides a rough illustration of progressivity in the U.S. as a whole. The numbers in the graph are state and local per pupil revenue by district poverty quintile. They are not dollar amounts because they are centered around the average for each district’s labor market to make them more comparable. If funding were progressive, the bars in the graph would slope upward left-to-right, since it would indicate that higher poverty districts receive more revenue than lower poverty districts. Regressive funding, in contrast, would be characterized by a downward right-to-left slope. Instead, what we find is that the bars are virtually flat – that is, higher-poverty districts receive no more or less state and local revenue than lower-poverty districts. Moreover, this has been the case for 20 years.
I would reiterate that this is just an approximation of the national average. But it is consistent with what you see if you examine the situation state-by-state – there are a handful of truly progressive states and a few that are truly regressive, but most states are basically flat. It is also consistent with other analyses that use alternative methods (e.g., Chingos and Blagg 2017).
This finding merits attention because it’s fairly well-established that it costs more to educate economically disadvantaged students than it does to educate non-disadvantaged students. For example, lower-income districts serve larger shares of special education students, non-native English speakers, and other groups that require additional resources. Disadvantaged students also tend to start school further behind their more affluent peers, and so schools serving the former have to make up a lot more ground.
Many policymakers (and courts) seem to understand this. Much of our federal education funding system, including Title I, the largest component, is targeted at higher-needs students. In addition, there is currently legislation in 35 states that directs additional funding to districts serving larger shares of low-income students, although these policies are often counteracted by factors such as regressive local funding and segregation (Chingos and Blagg 2017; Baker 2018).
This is not to say that pumping money into higher-poverty districts by itself would get results. Money can be spent ineffectively. On the flip side, progressivity alone is not enough. Funding must also be sufficient to reach outcome goals. A state's finance system can be highly progressive but still fall short if all students get shortchanged.
In short, decisions about how much money should be spent on education and how it is distributed are complicated and laden with political and fiscal pressure. It's very easy to say "we should do this" when you're not the one allocating finite resources between worthy competing priorities. But there is compelling evidence that narrowing funding gaps and/or increasing resources for districts serving disadvantaged students get results (Jackson et al. 2015; LaFortune et al. 2018; Candelaria and Shores 2019). Progressivity, while not a panacea, has an empirical track record. If legislators are serious about equal educational opportunity and narrowing outcome gaps, this is a viable “walk the walk” option.