U.S. Voter Turnout (And Registration) In Comparative Perspective
As is too often the case, Election Day last week was marred by stories of voter suppression and difficulties, from voter roll purges, to long lines and machine malfunctions at polling stations. Despite these disturbing situations, many of which were either avoidable or deliberate, around 100 million Americans turned out to vote for the first time in a midterm election.
This is heartening to be sure, but even with this landmark, only about half of eligible voters showed up to the polls. In a very real sense, everyone who turned out voted for two people. And this was not a random sample. Voters tend to be disproportionately white, older, better-educated, and higher income than their eligible, non-voting counterparts. The story of any U.S. election, particularly a midterm election, is as much about who didn’t vote as who did, although the question of how outcomes would change if non-voters showed up is not as clear-cut as is sometimes assumed (e.g., Leighley and Nagler 2014).
In any democratic election, there will always be people who do not exercise their franchise, for a wide variety of individual and institutional reasons. Voting behavior is complicated. There is, however, something not quite consistent about having a (possibly) record turnout midterm election in which half of eligible voters stay home. Those of us with a comparative research inclination might wonder if this is the case in other developed democracies.
In a recent report, the Pew Research Center looked at electoral turnout in OECD nations. The data they use come from a database maintained by the International Institute for Democracy and Electoral Assistance. The graph below is taken directly from the Pew post, and it presents turnout in each country's most recent national election.
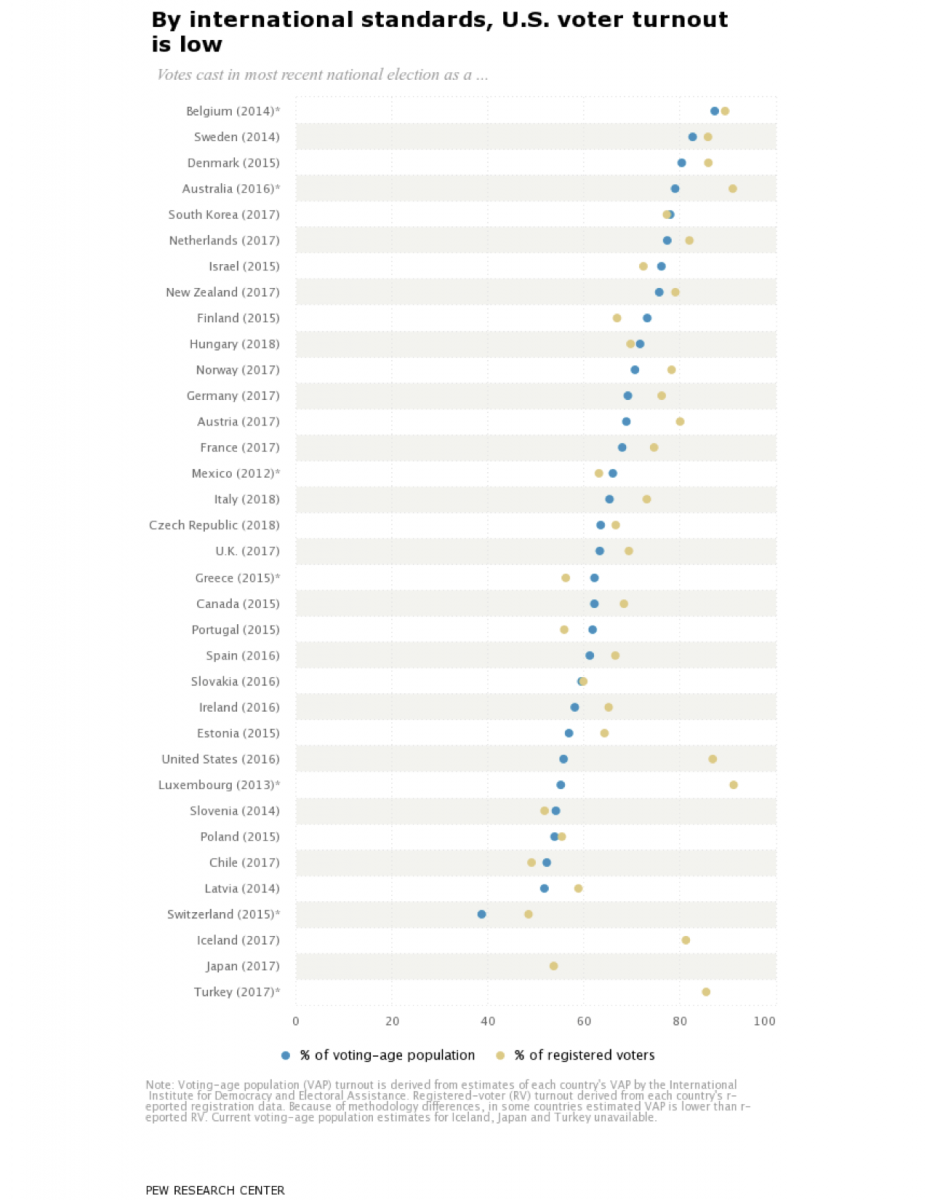
The blue dots in the graph, on which we’ll focus first, represent the percent of the voting-age population (VAP) that turned out in the most recent election, with the year of those elections noted in the country labels on the y-axis (the U.S. figures, of course, are for 2016).
Before discussing the graph, it bears noting that there are different ways to measure turnout. The VAP is simply the number of people in each nation who meet the voting age criterion in a given year (and VAP turnout, of course, is the number of voters divided by that voting-age population). Not all residents who are of voting age, however, are actually eligible to vote (e.g., non-citizens in the U.S.). As we’ll see, this complicates the comparison of turnout between nations.
Returning to the figure, VAP turnout ranges from almost 90 percent in Belgium, where voting is at least nominally compulsory, to under 40 percent in Switzerland. The unweighted average rate is 65.6 percent.
Turnout in the U.S. is among the lowest of all these nations - 56 percent in 2016. This is not too far off from several higher turnout nations, but it is still about 10 percentage points below the (unweighted) average.
Now we must return again to the issue of how to measure turnout, which is salient to the cross-national comparison of electoral turnout. In the U.S., for example, turnout as a percentage of VAP includes in the denominator many voting-age residents who are not eligible to vote (e.g., non-citizens, incarcerated people in all but two states). It also excludes a few million voting-eligible American citizens who live overseas.
That is why many scholars who study voting behavior calculate turnout as a percentage of the voting-eligible population (VEP). This is, in other words, the number of voters divided by the number of people who are legally eligible to vote (e.g., excluding non-citizens, etc., and including citizens/military living overseas). According to the invaluable database collected by Professor Michael McDonald at the United States Elections Project, using VEP as the denominator, turnout in 2016 was around 60 percent, about four percentage points higher than the VAP rate.
When comparing between nations, consider also that turnout can vary by election. In 2008, for example, VEP turnout in the U.S. (around 62 percent) was higher than in 2016, whereas, in 2012, it was a bit lower (58 percent). In addition, of course, U.S. turnout is lower in non-Presidential years. Finally, these same issues might affect the estimates for other nations as well (as might other factors, such as the accuracy of registration rolls). All of this means that comparing nations in the graph above should be done with caution.
That said, turnout in U.S. is, at best, lackluster, though the extent of the differences is somewhat difficult to pinpoint.
But that’s not really the most interesting part of the graph.
More revealing, perhaps, is the within-nation comparison of the blue dots with the gold dots – that is, the comparison of turnout among the voting-age population with turnout among registered voters. If, hypothetically, 100 percent of the voting-age population was registered to vote (and thus, presumably, eligible), then the two dots would be directly on top of each other, since turnout among all people would be the same as turnout among registered individuals.
In most nations, the two dots are within 5-10 percentage points of each other (the unweighted average of absolute differences is roughly seven percentage points). This is what we might expect – the vast majority of the eligible population is registered to vote. And it is no accident – in many of these nations, governments make a concerted effort to ensure high registration rates (in some cases via automatic registration). It is also why, in most developed democracies, one might use voters as a percent of registered voters as a proxy for VEP turnout.
In the U.S., in contrast, there is a roughly 30 percentage point gap between VAP turnout and that among registered voters. Only in Luxembourg is the gap comparable (due to that nation's uniquely immigrant-heavy population). About 56 percent of the U.S. VAP showed up in 2016, compared with a full 87 percent of registered voters. In other words, almost nine in ten of people who were registered to vote actually voted.
To reiterate, part of this gap (say, 4-5 percentage points) can be attributed to the difference between the voting-age and the voting-eligible populations (the latter, again, is higher than the former). But most of the enormous discrepancy is indicative of the simple fact that voter registration in the U.S. is generally the responsibility of the voter (and, in many places, is not easy). As a result, only about 70 percent of eligible voters are actually registered.
From this perspective – and this is far from a novel idea, but it always bears mentioning – relatively low voter turnout in the U.S. may be, at least in some part, a function of low voter registration. And, it follows, making registration easier may be a particularly effective means of increasing voter turnout in the U.S.
Now, to be clear, it would be foolish to expect that the 87 percent turnout rate among registered voters would remain stable after a concerted effort to increase voter registration. The same things that motivate people to register might motivate them to vote (or serve as barriers), and so it is virtually impossible that the approximately 30 percent of unregistered voters, if registered, would show up at a 85-90 percent clip. Yet, even if only one in ten ended up voting, turnout would increase 3-4 percentage points (see, for example, Neiheisel and Burden [2012]). This would be an extremely important change, particularly in a country where so many recent elections are decided by thin margins.
In short, in the U.S., more so than in most any other OECD nation, registration may be an additional barrier to voting. Obviously, voters need to be registered, but it’s difficult to explain how 30 percent of eligible voters are not registered without concluding that the process can be made easier (e.g., by same-day registration). We cannot expect everyone to turn out to vote in every election. But we can at least make sure that they have the opportunity to do so if they choose.