The Long Shadow of Racial Housing Discrimination
Earlier this year, we published a report on the relationship between housing discrimination/segregation and school funding disparities. I would encourage you to check it out. But I’d like to discuss the substance of the report from a somewhat broader perspective.
Our analysis, while it includes a lot of national results, consists largely of “case studies” of seven metro areas. In order to interpret and understand our results, we relied heavily on the work of scholars who had focused on those areas.1 And that included a great deal of specific history that one might not see in (otherwise excellent and very important) large scale segregation analyses. These histories illustrate how, in every metro area, the effort to keep white and non-white families living in different neighborhoods was a deliberate plan.
Multiple institutions, public and private, all played a part. That means city governments, the federal government, courts, the real estate industry, the finance industry, and homeowner associations. And the plan adapted to changing circumstances. When segregative tools became obsolete or illegal, new tools were developed to keep building on past efforts. A few of these tools are still in use today.
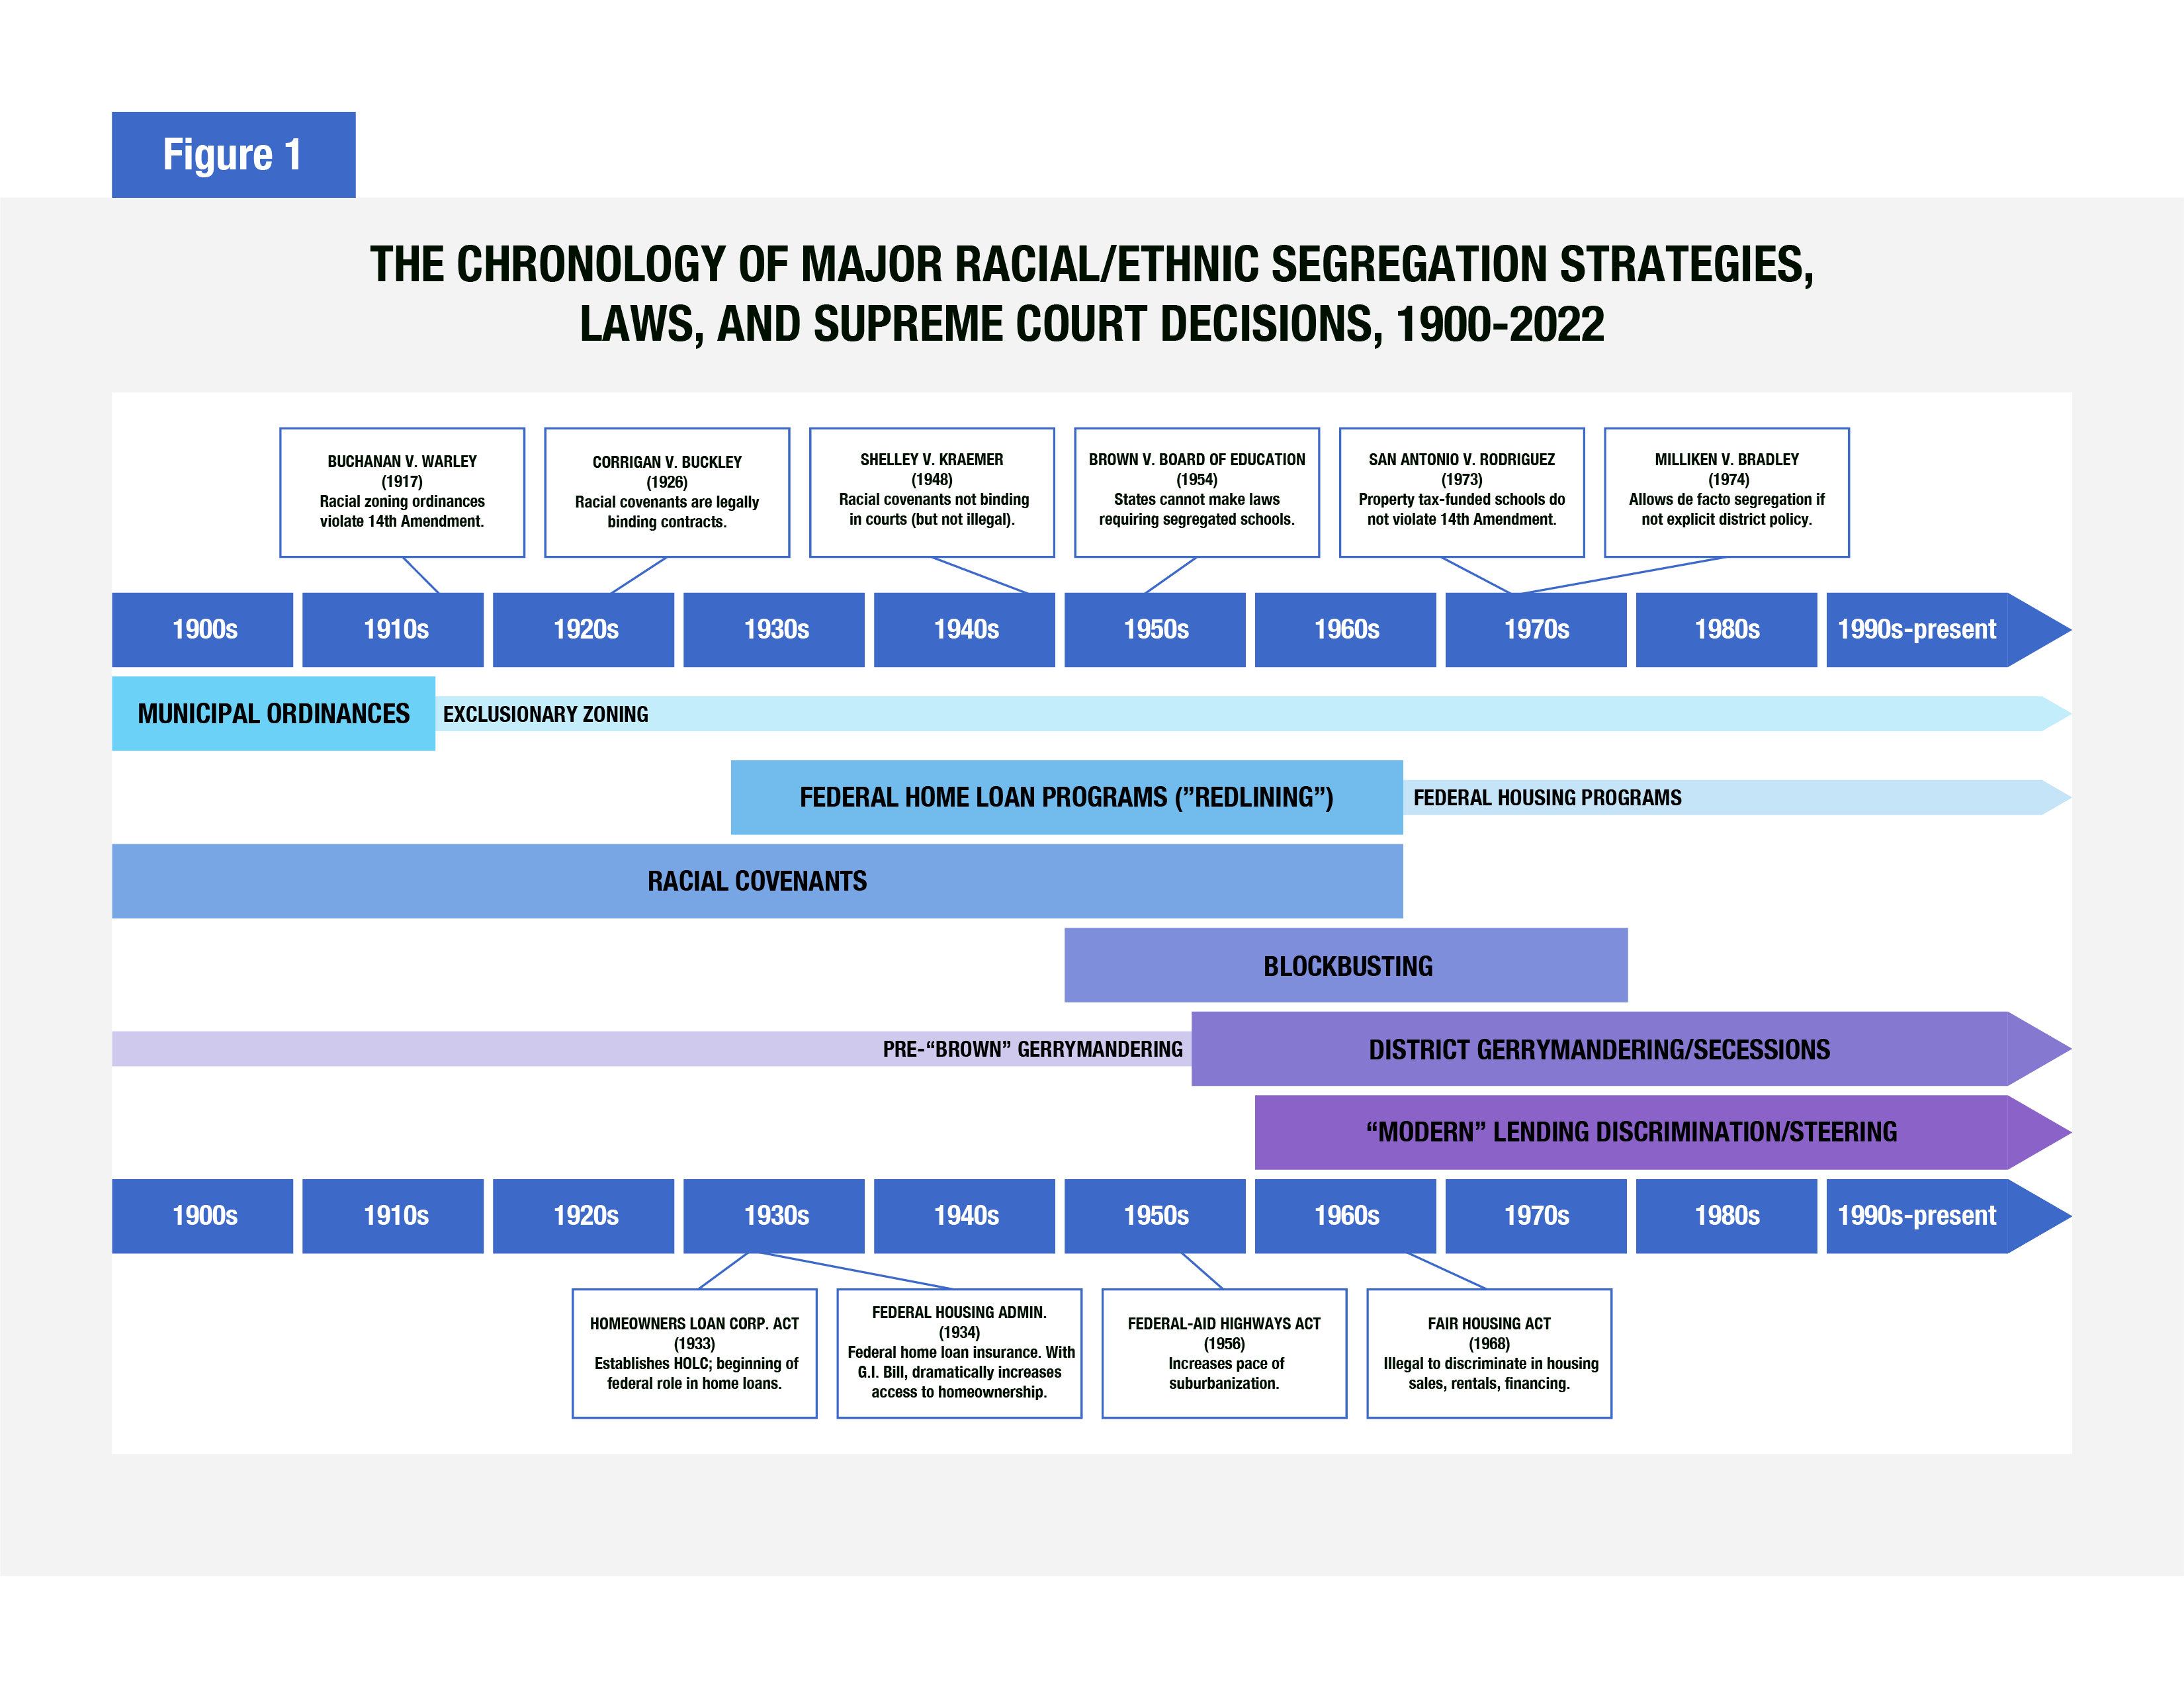
Even going in knowing roughly what to expect, it’s still not easy to read the municipal laws that laid out which city blocks—based on racial composition—were available to non-white residents of Baltimore (and several other major cities) during the earliest decades of the 20th century. Segregation by law.
Nor is it anything but horrifying to go through the detailed descriptions accompanying the infamous “redlining” maps, which were part of a system of racialized risk assessment and property valuation that largely excluded people of color and other groups from the loan insurance programs that fueled a massive expansion in home ownership and built suburban America.
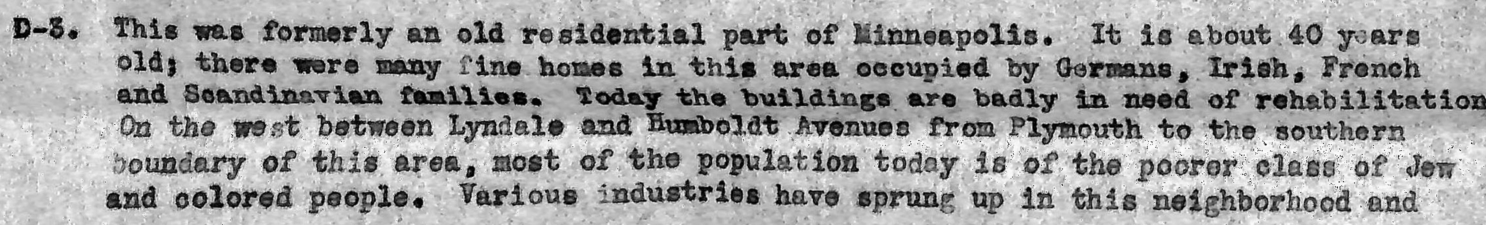
In one sentence, the narratives accompanying these “redlining” maps say something about how lending risk is high in a given neighborhood because the buildings are dilapidated and there is pollution or poor transportation. In the next sentence—as if it’s the most natural thing in the world—they might also note the possibility of “Negro encroachment,” or how there are “Negros throughout the area,” or the fact that, in the appraiser’s view, “most of the population today is of the poorer class of Jew and colored people” (the scan below is from the Mapping Inequality Project).
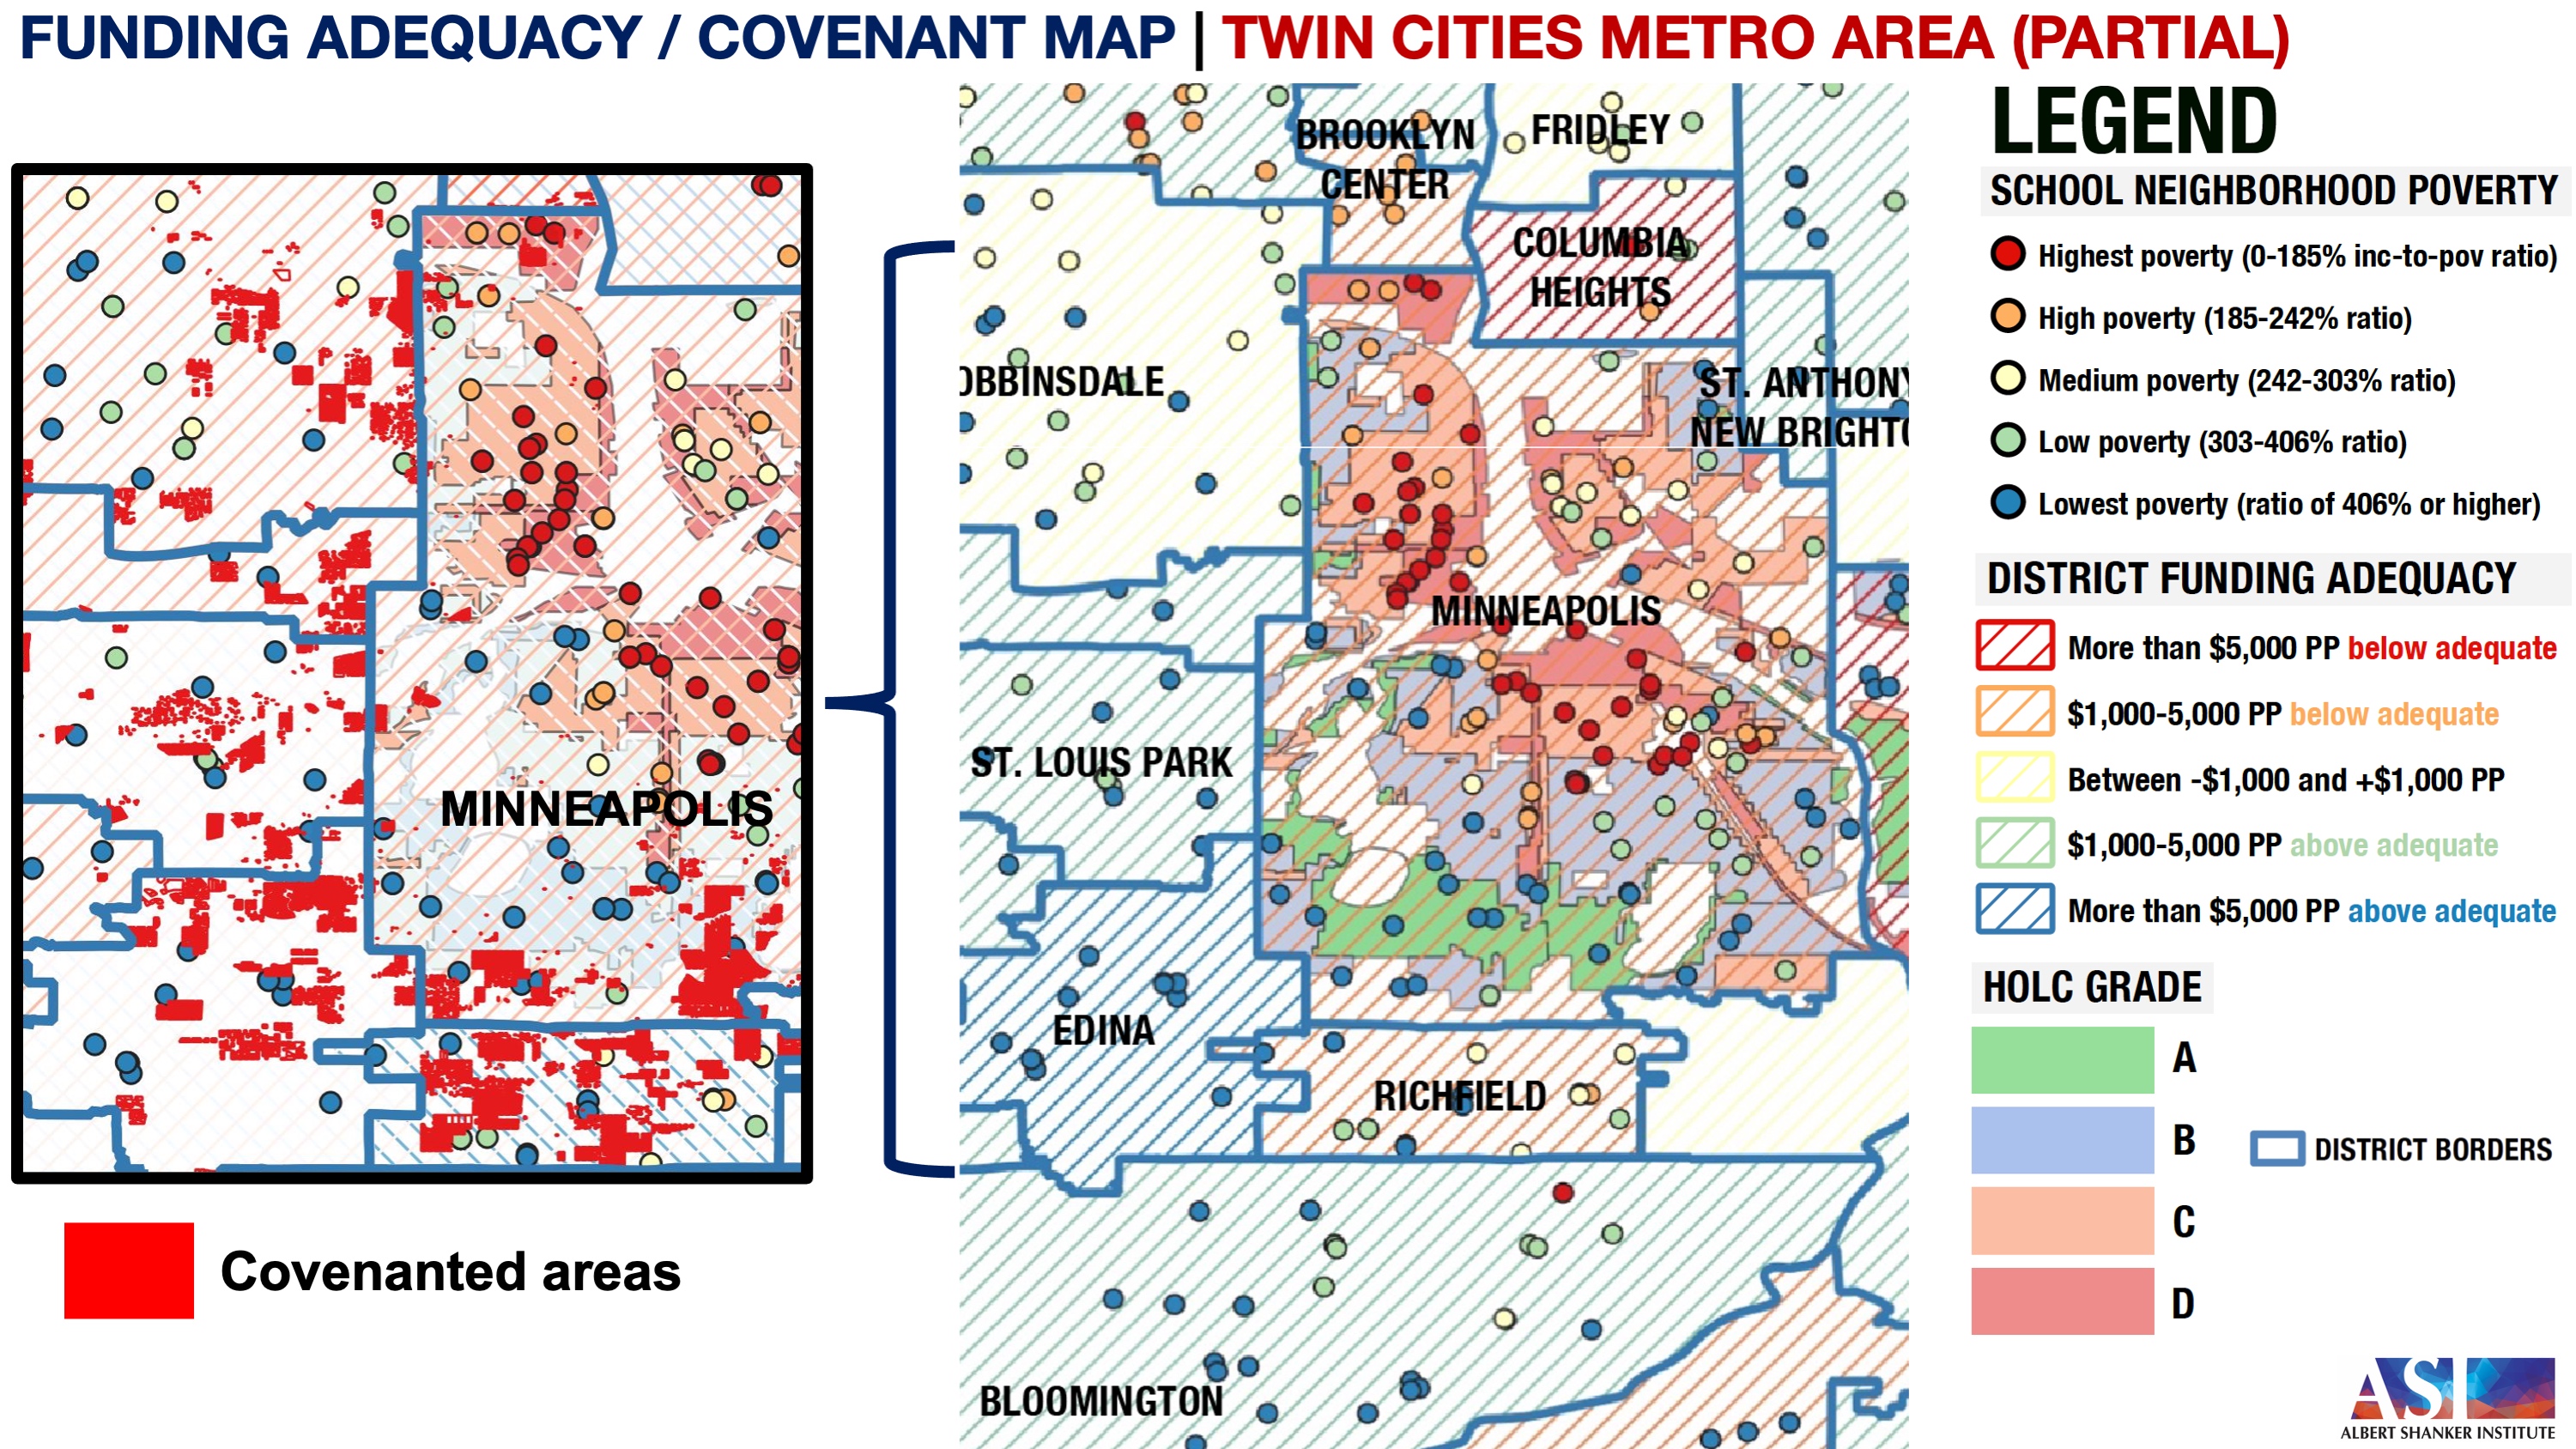
And it’s equally disturbing to see how racial “covenants,” which were private contracts forbidding the future sale of homes to non-white families—and which were often a prerequisite for receiving federal home loan assistance—surrounded the non-white areas of cities such as Minneapolis like a wall, preventing the “infiltration” of these families into adjacent suburbs (in the figure below, the maps are from our report, but the map inset on the left also includes covenant data gathered by the Mapping Predjudice Project at the University of Minnesota).
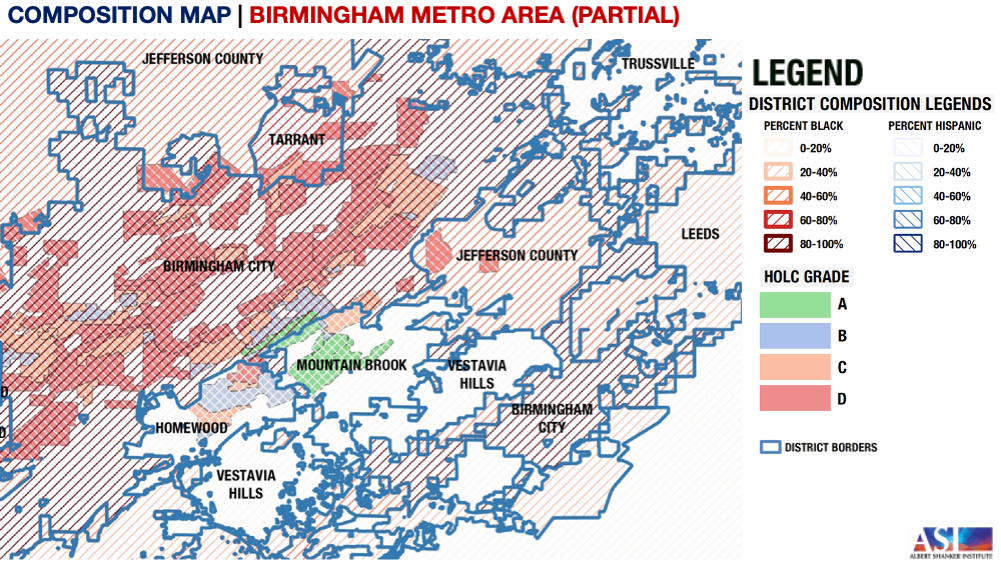
Or, more recently, how mostly white school districts in Alabama seceded from their parent Jefferson County district, several within the past two decades, and how these districts have been carved out so precisely based on race that the Birmingham metro area school district map (below) is a jagged mess, with gerrymandered white districts surrounded on all sides by districts serving large proportions of students of color.
The list goes on. The seven metros on which we focused are quite different in terms of location, demographics, development timelines, finance policies, and many other factors. Yet the same set of tools was (and still is) used to segregate all of them, with largely the same effects on district racial composition and funding.
Today, there seems to be a viewpoint among some people—and I may be generalizing a bit here—that explicitly racial housing discrimination is illegal and extremely rare, and that where racial gaps in outcomes or access occur, they are due almost entirely to income or wealth inequality, rather than race/ethnicity per se. There are two problems with this argument.
First, while it may be fair to say that there’s less “direct” discrimination than there was prior to the late 1960s—and it takes different forms—the evidence suggests that it’s far from rare. Studies of access to housing and home financing, many of which are audit studies in which applicants of different races are randomly assigned to attempt to rent or buy homes, show that applicants of color are consistently more likely to experience adverse treatment during housing searches, are more likely to be denied loans and turned down by landlords, are often shown different properties by realtors, and pay higher interest rates than similarly qualified white subjects (e.g., Munnell et al. 1996; Turner et al. 2005; Williams et al. 2005; Pager and Shepherd 2008; Rugh and Massey 2010; Kuebler 2012; CT Fair Housing Center 2017; Bartlett et al. 2022).
The second problem is that the racial gaps in access to housing or in related outcomes (e.g., wealth) that might ostensibly be chalked up to other factors are themselves often due to the legacy (and current effect) of racial discrimination. For the vast majority of us, owning a home is the single biggest source of wealth and financial security, within and between generations. And where we live affects almost everything: health, diet, schooling, economic opportunity, social networks, and dozens of other outcomes. Among the most effective ways to suppress intra- and inter-generational improvement on these outcomes among a group of people is to force them to live in the same place.
People of color born in the U.S. after 1970 or so are the first generation in their families who have not lived during a time in which open and explicit racial discrimination was essentially legal. The negative effects of discrimination don’t just disappear even if discrimination stops (which, again, is not the case). These effects, like segregation itself, are self-reinforcing.
There’s a reason why the “redlining” maps from 1935-40 do a pretty good job of predicting racial/ethnic composition, school funding, and so many other outcomes today, 80 years later (e.g., Mitchell and Franco 2018; Aaronson et al. 2021a; Aaronson et al. 2021b; Lukes and Cleveland 2021). And it's no accident that, as we show in the report, the overwhelming majority of metropolitan school districts in which African Americans or Latinos are overrepresented are less adequately funded than their metro areas overall.
Yes, there’s an interplay between economic and racial/ethnic inequality (and segregation) and it’s complicated. But racial discrimination built that machine, even if economic inequality helps keep it running today.
1 That includes, for example, Kevin Fox Gotham’s copious research on Kansas City, Jack Dougherty in Hartford, the Othering and Belonging Institute on the Bay Area, Erica Frankenburg and EdBuild about Birmingham, HOLC data from the Mapping Inequality Project (University of Richmond), and all the great work by other scholars, such as Nancy Denton, Douglas Massey, Sean Reardon, and Richard Rothstein, Victoria Sosina, and Ericka Weathers, just to name a tiny few.