More On What "Superman" Left Out
Our guest author today is Diane Ravitch, Research Professor of Education at New York University and an historian of education. In addition, she is a nonresident senior fellow at the Brookings Institution in Washington, D.C.. Her latest book is The Death and Life of the Great American School System.
In my recent article for the New York Review of Books about “Waiting for Superman," I praised the SEED Charter School in Washington, D.C. (one of the schools featured in the movie) for their high graduation and college acceptance rates. I also pointed out, however, that they spend about $35,000 per student, three times as much as normal schools spend. This fact was not mentioned in the movie.
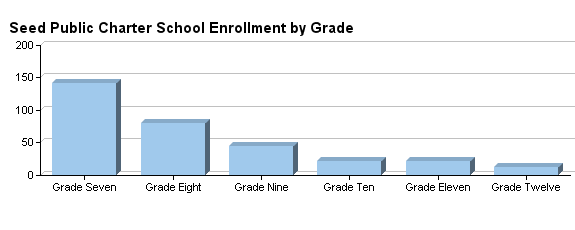
Nor was the school’s incredibly high attrition rate. Take a quick look at the graph below (hat tip to Leigh Dingerson). They start out with about 150 students in seventh grade, but their enrollment slowly declines to around 30 in grade twelve. This level of attrition is alarming, and it makes any simple evaluation of SEED’s results impossible.
A D.C. public school could not have this kind of attrition – they must take what they get – and they are criticized for poor results. This is not fair.
I think the teachers and staff at SEED are doing heroic work. They get amazing results for some of their students, as do regular public schools. There ought to be a requirement that schools, whether charter or regular public, disclose their attrition rates when releasing their graduation rates.
*****
Administrator note: In a post-publication comment (below), Diane provides a description of these data, which is pasted here for convenience:
The graph is grade-by-grade enrollment in SEED in 2008-09. For the grades in the graph, during this time period, SEED only accepted students starting in seventh grade. That means that each grade in the graph represents a cohort of students who started in 7th grade. If the size of the incoming cohorts remains relatively stable each year, then the decline in enrollment between 7th and 12th grade reflects high attrition (rather than differences in the sizes of cohorts). Here is the 7th grade enrollment by year (from NCES):
2003-04: 130 2004-05: 145 2005-06: 140 2006-07: 145 2007-08: not available
For example, the 12th graders in the graph are the students who entered SEED for the 2003-04 school year. There were 130 of them. By the time they reached 12th grade, there were fewer than 20. The vast majority of 12th grade students may have graduated, but that’s only because most of their cohort was gone by the time graduation rolled around.


With selective enrollment (disconnected parents don't get in a lottery)and an artificial learning system, it is amazing that students still have to be subtly pushed out of school. If it gets better, look out for other subtle ways of skimming. http://www.wholechildreform.com/graduationratefarce.html