State Budget Cuts And School Districts With Pre-Existing Conditions
The Center on Budget and Policy Priorities has published projections of state budget shortfalls due to the pandemic. The total estimated shortfall for fiscal years 2020-2022 is $555 billion. This includes $290 billion in FY2021 alone, a deficit over 25 percent larger than that in the worst year of the Great Recession (2009).
Compared with the sickness and death caused by Covid-19, state budget shortfalls are just collateral damage (though remember that states spend a lot on healthcare). But it could be a lot of damage. Unlike the federal government, virtually all states are required to balance their budgets every year. They cannot spend more than they raise in revenue, which means any deficits must be balanced out by cuts. Suppose we take these CBPP projections at face value, and subtract from them existing federal aid forthcoming and total state budget reserves. That, according to CBPP, still leaves states about $400 billion short for this past fiscal year and the next two (and there could easily be shortfalls in subsequent years).
Virtually all public school districts will feel this pain, but it will not be felt equally. Higher poverty districts are more dependent on state revenue, since more affluent districts generate more revenue from local sources (mostly property taxes). But the situation is even worse: higher poverty districts are already spending far less than they need to be. In a sense, the pandemic is going to be particularly harsh on districts with pre-existing conditions.
The graph below presents estimates of spending adequacy for the U.S. as a whole, by poverty quintile, with adequacy defined as the amount that would be required to achieve national average test scores. This measure is part of the School Finance Indicators Database, and you can view the estimates for each state separately here. The graph is taken directly from our annual report, which presents key findings from the database. The estimates are calculated state-by-state, but here we present a national average (weighted by enrollment), which offers a rough overview of the national situation.
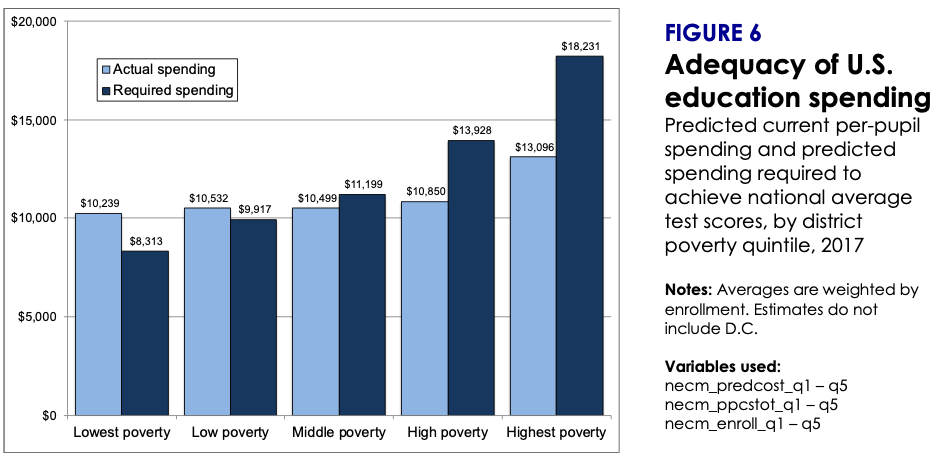
The basic message of the graph is that more affluent districts, on average, are spending enough to achieve national average test scores (which most do in fact achieve), whereas spending in higher poverty districts falls far short of estimated requirements. In the 20 percent highest poverty districts, for example, actual spending (the light blue bar) is almost 30 percent less than our estimated adequate level (the dark blue bar). And it's not much better in the second highest poverty quintile, where actual spending is about 22 percent below adequate.
Now, to be clear, our adequacy estimates are not meant to imply that spending these amounts, in and of itself, would immediately and drastically increase test scores in a given state or district (nor, of course, do we believe that test scores are necessarily the only important outcome). Real progress is slow and sustained, likely multi-generational. Our model simply evaluates the adequacy of states' spending levels against a common benchmark (national average test scores). And the most charitable interpretation is that public school funding in the U.S. is backwards — the districts that need the most resources receive, on average, the least. The more hard-edged interpretation is that, for all but the most affluent districts, spending is woefully inadequate.
Our adequacy measures do not go back to the years before the Great Recession of 2007-09, but there is no question that the impact of that recession on school budgets, which in many states persists to this day, made the situation substantially worse. Absent massive federal assistance, that's going to happen again. And it will keep happening during economic downturns until we make fundamental changes to how we fund our public schools.
Wow. Those statistics are
Wow. Those statistics are sobering. Your statement, "the pandemic is going to be particularly harsh on districts with pre-existing conditions" is so true and scary. Thanks for sharing.