Teacher Contracts: The Phantom Menace
In a previous post, I presented a simple tabulation of NAEP scores by whether or not states had binding teacher contracts. The averages indicate that states without such contracts (which are therefore free of many of the “ill effects” of teachers’ unions) are among the lowest performers in the nation on all four NAEP exams.
The post was largely a response to the constant comparisons of U.S. test scores with those of other nations (usually in the form of rankings), which make absolutely no reference to critical cross-national differences, most notably in terms of poverty/inequality (nor to the methodological issues surrounding test score comparisons). Using the same standard by which these comparisons show poor U.S. performance versus other nations, I “proved” that teacher contracts have a positive effect on states’ NAEP scores.
As I indicated at the end of that post, however, the picture is of course far more complicated. Dozens of factors – many of them unmeasurable – influence test scores, and simple averages mask them all. Still, given the fact that NAEP is arguably the best exam in the U.S. – and is the only one administered to a representative sample of all students across all states (without the selection bias of the SAT/ACT/AP) – it is worth revisiting this issue briefly, using tools that are a bit more sophisticated. If teachers’ contracts are to blame for low performance in the U.S., then when we control for core student characteristics, we should find that the contracts’ presence is associated with lower performance. Let’s take a quick look.
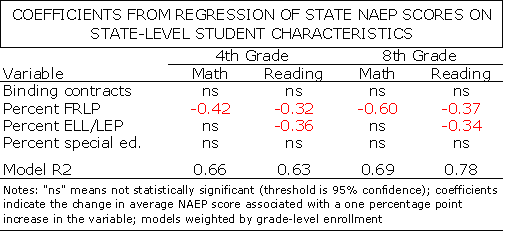
In the table below, I present simplified results for four multiple regression models (one for each NAEP subject/grade combination, with data from the NAEP Data Explorer). In addition to a variable controlling for whether or not states have binding contracts, I included state-level variables measuring the percent of students in each state who: are eligible for free/reduced-price lunch (FRLP); are English language learners ELL); and have individualized education programs (special education). The models are weighted by grade-level enrollment, and the data on student characteristics are from the National Center for Education Statistics (2008-09).
Before reviewing the results, it is important to note that these regressions must be interpreted with caution. The use of state-level data always masks the nuances that occur at the district- and school-levels, and the four variables in the models hardly represent the full slate of potentially important factors. In addition, the sample is small. Nevertheless, these models can certainly provide a rough idea of the association between the presence of binding contracts and NAEP performance, holding constant the state-level “effects” of the three most commonly-used student characteristics.
Let’s take the results quickly from the bottom of the table. First, I find no association between a state’s NAEP scores and the percent of its students that are in special education programs.
In contrast, the “effect” of having more ELL students is rather large in English, but not math, which makes intuitive sense. Holding all other variables constant, for every one percent increase in a state’s ELL student population, there is a roughly 0.35 point decrease in NAEP scores. This association would therefore likely depress overall reading scores in states with very high proportions of ELL students, such as California (24.0 percent) and Nevada (17.5 percent). The U.S. average is roughly six percent.
The only variable that is associated with scores on all four tests is the percent of low-income (FRLP) students, with large, significant coefficients ranging from -0.32 in fourth grade reading to -0.60 in eighth grade math. So, once again, states with very high FRLP eligibility rates, such as D.C. and Mississippi (both are about 25 percentage points higher than the U.S. average), are likely to see much lower NAEP scores, with differences ranging from -8 to -25 points, which are huge for NAEP.
Finally, in all four models, the association between scores and whether or not states have binding contracts is not statistically significant at any conventional level (even at the 90% confidence level). So, while this analysis is far from conclusive, I certainly find no evidence that teacher union contracts are the among the biggest reasons why achievement is low, as Davis Guggenheim and countless others imply (see here and here for more thorough analyses, which actually show small positive benefits of unions).
In fact, while the proportion of ELL and especially low-income students maintain strong associations with performance, the presence of binding teacher contracts doesn’t seem to affect test scores at all.
Let’s sum things up on the “contract/union effects” front. Binding contracts are not associated with lower NAEP scores, at least at the state-level. Charter schools, which are largely free of both unions and their contracts, overwhelmingly perform no better than regular public schools (see also here and here). And the undisputed highest-performing nation in the world, Finland, is wall-to-wall union, with contracts, tenure, and all the fixings.
Look – teacher contracts are not perfect, because the teachers and administrators who bargain them are not perfect. There are many common provisions that can and should be improved. But placing primary blame for poor student performance on union contracts is both untrue and extremely counterproductive. If we all stop pointing fingers, perhaps we can have a more comprehensive, realistic, and constructive conversation about why some U.S. schools are failing, and what can be done to fix them.

