Interpreting Effect Sizes In Education Research
Interpreting “effect sizes” is one of the trickier checkpoints on the road between research and policy. Effect sizes, put simply, are statistics measuring the size of the association between two variables of interest, often controlling for other variables that may influence that relationship. For example, a research study may report that participating in a tutoring program was associated with a 0.10 standard deviation increase in math test scores, even controlling for other factors, such as student poverty, grade level, etc.
But what does that mean, exactly? Is 0.10 standard deviations a large effect or a small effect? This is not a simple question, even for trained researchers, and answering it inevitably entails a great deal of subjective human judgment. Matthew Kraft has an excellent little working paper that pulls together some general guidelines and a proposed framework for interpreting effect sizes in education.
Before discussing the paper, though, we need to mention what may be one of the biggest problems with the interpretation of effect sizes in education policy debates: They are often ignored completely.
Studies that find a statistically significant positive effect of a given policy are usually touted by advocates as evidence of that policy “working,” with little or no regard for the magnitude of that effect. This matters because the estimated effect sizes in these studies are sometimes so small as to be educationally meaningless. In other words, "statistically significant effects" aren't always educationally significant. (Conversely, even non-significant results might still be worth looking at, especially when samples are small, but that's a different story.)
Now, back to the Kraft paper. He presents five general guidelines for interpreting effect sizes, which I discuss very briefly in turn (I’ve skipped a lot of detail here, so I recommend that you read the paper if you're interested in the full discussion).
One – estimated “effects” aren’t always – or even often – effects per se. In short, when you’re interpreting an “effect size,” the first step is to evaluate whether it’s just an association or a causal effect per se. This is a version of the standard “correlation is not causation” caveat. The term “effect” implies causality, but it’s a technical term, and not all research designs are appropriate for causal conclusions (this paper is a pretty good primer; if you know of others, please do leave them in the comments). This is not to say that correlational “effects” can’t tell you anything, but they are best interpreted as suggestive evidence of a causal relationship, and their magnitudes should be regarded with extreme caution.
Two – effect size depends on what is being affected, and when it is measured. There are a few underlying aspects to consider here, but for our purposes let’s just say that, all else being equal, some outcomes, due to their nature or timing, are more “vulnerable” to intervention than other outcomes, and may therefore tend to exhibit larger effect sizes. For example, an elementary school tutoring program will likely have a larger impact on next year’s test scores than it will on how much graduates earn once they enter the workforce. This is because: 1) test scores are direct measure of content knowledge that tutors are imparting, whereas earnings reflect many factors; and 2) test scores are measured relatively soon after the tutoring, rather than years after. Of course, education research is dominated by testing outcomes, but even then the point is relevant – for example, math scores are generally more subject to change due to policy interventions than reading scores.
Three – differences in study design or analysis, sometimes due to researchers’ subjective decisions, influence effect sizes. Once again, some of the issues here are a bit technical, but suffice it to say that effect sizes can be different depending on the composition of the group receiving the treatment (is the intervention targeted or universal?), the group to whom they are compared (the non-treated sample), and other technical considerations.
Four – costs matter. This point is enormously important, and while it seems obvious, it actually gets ignored quite frequently. Some interventions cost more than others, and it is crucial to keep this in mind when evaluating the size of estimated effects. Thinking about costs can be as simple as considering how much money was spent per student, or can be more complicated, such as evaluating opportunity costs (spending money on one given policy rather than a different one). In any case, considering cost effectiveness is so important as to be an absolute necessity in the policymaking process, and ignoring it is tantamount to malpractice.
Five – consider whether interventions can be scaled up when evaluating effect sizes. In part, this point is about external validity – that is, whether the effects of a given intervention when applied to a specific group of students will hold up when the intervention is applied to a larger, more representative group of students. Moreover, Kraft points out that, even when estimated effects are externally valid, scaling up can be complicated by implementation difficulties and political challenges. These considerations may be highly relevant to policymakers and others using research to make or advocate for policies.
***
After laying out these general guidelines, Kraft goes on to propose a new framework for interpreting effect sizes from studies with causal designs, specifically those using test-based outcomes. He takes the step of proposing actual thresholds, which, while inevitably a bit subjective (as he notes repeatedly), really adds to the paper’s practical utility. He also uses meta-analysis to get a sense of effect sizes and costs from the literature.
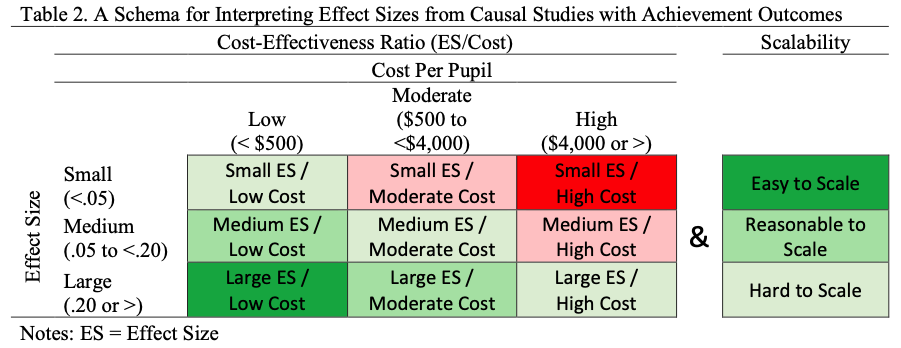
Kraft proposes that effect sizes under 0.05 standard deviations might be regarded as small, 0.05 to 0.20 s.d. as medium, and 0.20 s.d. or above as large. He then combines these effect size thresholds with costs to create a matrix, pasted below, in which per pupil costs under $50 are low, $50-$4,000 medium, and over $4,000 high.
In the effect/costs matrix, pasted below, we end up with nine cells, with the diagonal representing what you might call moderately impressive cost effectiveness, and the two off-diagonal corners (small effects/high costs and large effects/low costs) representing the least and most impressive scenarios, respectively. As you can see, there is also an effect/scalability the matrix, with the latter characterized trichotomously (hard, reasonable, easy).
In my view, this framework, particularly the inclusion of concrete thresholds, is an excellent starting point for a discussion about the very thorny issue of interpreting and acting upon effect sizes in education policy.
The hopeless technocrat in me would like to believe that policymakers’ decisions are based on a framework similar to Kraft’s in form if not content. That is, effect sizes from high-quality research using causal designs, along with considerations about cost, scalability, and other factors, play a major role in which policies are enacted, scaled, and terminated. And I think that’s the case, to some extent. But there’s also plenty of circumstantial evidence suggesting that politics, rather than research, plays a primary role in determining the fate of many policies. That is, politically popular policies will be implemented and sustained regardless of the research, and unpopular policies will not.
No doubt both political and empirical factors are at play in the policymaking process. In any case, more informed interpretation of effect sizes would be invaluable in helping to smooth the road between research and policy.
This article (and the Kraft
This article (and the Kraft paper) fails to understand recent work on effect size (e.g. http://tinyurl.com/y6hngylt). There is no way of interpreting ES as a measure of the effectiveness of the intervention - e.g. the same experiment with the same test using multiple choice answers instead of short form responses will give a very much smaller ES. So we cannot decide policy by comparing ESs [either against each other or against a fixed boundary such as 0.2].
I think a later paper by
I think a later paper by Simpson gives a gr8 analogy-
Simpson, Adrian (2018). Princesses are bigger than elephants: Effect size as a category error in evidence-based education. British Educational Research Journal. Vol 44, Issue 5.
Simpson shows comparing sizes of objects on a photograph is akin to comparing effect sizes. He shows if doing this, you could conclude princesses are bigger than elephants.
I'm putting together a critique of Hattie's work, who dominate Australian Education & uses this method of comparing effect sizes. Please feel free to contribute here- http://visablelearning.blogspot.com/