Are Public Employee Unions To Blame For States' Budget Crises?
A disturbing number of people are blaming public sector unions for states’ current budget crises (also here, here and here). Their basic argument is that unions have seriously exacerbated budget shortfalls because a significant proportion of state spending is tied up in employee compensation, and unions, via collective bargaining, increase salaries and benefits. As a result, so the line goes, unions have created unsustainable expenses for state governments in a time of declining or still-recovering revenues.
Needless to say, the relationship between unions and state revenue/spending is complex. The claim that unions are responsible for state budget gaps (or at least for larger gaps) is therefore extremely difficult to examine, especially during a fiscal crisis. Nevertheless, we can take a quick, modestly rigorous look.
There are 30 states that provide collective bargaining rights for state employees, virtually all of them via state laws. One way to evaluate the merit of the accusations above is to see whether states that allow collective bargaining have more severe budget problems than those that do not.
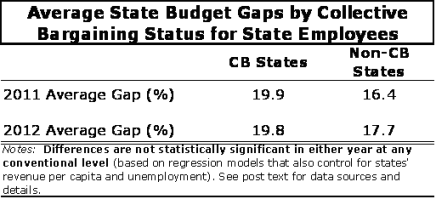
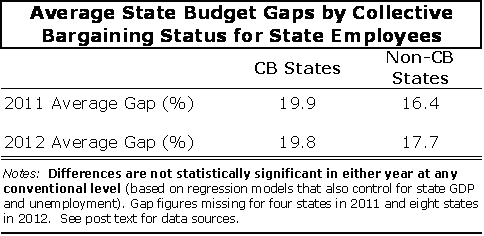
To start, I calculated the average budget gap (as a percent of states’ total budgets) for each group of states – those with collective bargaining (CB) and those without it. I do this for both FY 2011 and 2012 (projected), using data from the Center on Budget and Policy Priorities (estimates are only available for 46 states in 2011, and 42 states in 2012). The averages are weighted by the size of states’ total budgets, and presented in the table below (D.C. is excluded from this analysis).

The table shows that the raw differences between states with CB and those without it are evident but rather modest – within 2-4 percentage points. They might, however, just be random – one or two large states in either group might be inflating or deflating the differences. More importantly, other factors, such as unemployment, may be at least partially responsible for these discrepancies – for example, if CB states tend to have higher unemployment than non-CB states, their gaps might be wider (due to lower tax revenue), independent of any “union effects."
To partially address these possibilities, I estimate simple regression models (one for each fiscal year) of the relationship between budget gaps and CB, also controlling for a couple of other factors that might influence states' fiscal situations, using the most recent available data: state median household income (from the U.S. Census Bureau); and annual unemployment rates (from the Bureau of Labor Statistics).
For both 2011 and 2012, the CB/non-CB difference was actually negative (CB was associated with smaller budget gaps), but it was not statistically significant at any conventional level - the negative CB "effect" should be regarded as random noise (though it may also be due to the small sample). (Side note: The differences are not significant even without the control variables.)
Of course, this analysis not even remotely conclusive (for a number of reasons), but the results do represent fairly compelling evidence that the right of state employees to bargain collectively is not associated with the size of their states’ budget shortfalls.
We might, however, think more expansively about the “effect” of public sector unions. Some states, such as Indiana, do not permit collective bargaining for state workers, but do allow it among other public employees, especially teachers. These states might also have larger budget gaps as a result, since a substantial portion of state funding goes to public education. Other states allow non-binding agreements among public employees (including teachers), which could drive up wages and benefits even if they’re not CB agreements in the strictest sense (they can be broken at will by management).
It may therefore be useful to also take a look at how budget gaps vary by the total proportion of public sector workers who are covered under contracts or agreements of any sort.
The “coverage” data I use are provided by Professors Barry Hirsch (Georgia State University) and David McPherson (Trinity University), based on their analysis of the 2010 Current Population Survey (data/documentation available here). These figures include teachers and other local government workers who have binding or non-binding agreements. They also include, for example, residents of a state who are unionized federal government employees (e.g., letter carriers), but they are a small minority in most places.
In the figure below, I plot states’ budget gaps by the percent of public sector employees who are covered under any type of agreement. For space purposes, I will only present the graph for FY 2011 (the 2012 scatterplot is extremely similar).

The graph suggests that there is no consistent relationship between budget gaps and union coverage. Many states with low public sector coverage have large gaps, while many heavily-unionized states face relatively small shortfalls.
To "confirm" this, I once again estimate regression models (controlling for median income and unemployment) to test the relationship between union coverage and budget gaps – the difference is again negative (but miniscule) and not statistically significant in either 2011 or 2012. So, even by this highly-inclusive definition, unions do not appear to have much influence on the size of shortfalls.
It is worth returning very briefly to the graph. The state with the largest 2011 budget gap – Nevada – has only moderate coverage (and does not allow collective bargaining for state workers). Similarly, Arizona has the nation’s fourth largest gap, but a relatively low coverage rate (and no collective bargaining for state workers as well). Just anecdotally, both states do share two other things in common: They are both among the top five in terms of foreclosure rates, and they both have among the top ten most regressive state and local tax systems in the nation (i.e., the poor pay a larger share of their income than the rich, which is true in all states, but particularly so in these two). These, unlike unions, are real causes.
Conversely, many states, such as New York and Massachusetts, have extremely dense union coverage among public employees but rather modest-sized budget gaps (Massachusetts has one of the lowest shortfalls in the nation). Incidentally, New York is also among the three or four states with a tax system that even approaches fairness, while the system in Massachusetts is far less regressive than the vast majority of other states.
Again, the analysis above is limited and requires cautious interpretation. Also, the outcome I am looking at – state budget shortfalls – only partially reflects unfunded pension liabilities, which, though widely overstated and misunderstood, are a significant concern going forward.
Nevertheless, the results above certainly suggest that the animus toward public sector unions is misplaced: There seems to be no strong relationship between the existence or strength of public sector unions and budget shortfalls. Attempts to blame public employee unions – or public employees in general – for states’ fiscal woes are monumentally simplistic and, usually, have more to do with politics than parsimony.
This is all interesting, but mostly misses the point: public sector workers have bargained for pension benefits that are collectively at least $1 trillion underfunded (according to Pew) and $3 trillion underfunded (if you don't make the wildly optimistic assumption that investments are going to make a guaranteed 8% every year).
Whether or not they caused some other fiscal and budgetary crisis, public sector pensions are a fiscal crisis unto themselves.
Politicians give the rich tax breaks and then cry foul blaming the unions. That is the reason for the underfunded pensions. Has nothing to do with CB, has nothing to do with unions, everything to do with corruption!
This graph would be better if it were color coded say collective bargaining states in blue, non collective bargaining in red. that way one could (or at least might) see a general trend rather than selecting four states which may have been chosen to prove author's thesis.
Is this the right question to ask? Shouldn't we be looking at the interplay between "cost of government" and higher taxes in each state. While I don't know for sure, it seems that that might produce a different result for collective bargaining.