How Much Has Education Spending Increased Over Time?
Our guest author today is Mark Weber, Special Analyst for Education Policy at the New Jersey Policy Perspective and a lecturer in education policy at Rutgers University.
The issue of how much the U.S. spends on K-12 public schools rightfully receives a lot of attention. More often than not, these discussions rely on simple data, such as average per-pupil spending over time across the entire nation. I would argue that the variation in spending, both within and between states, is so enormous as to render national comparisons potentially misleading, and also that the more consequential question is not just how much states and districts spend, but whether their spending levels are commensurate with their costs.
That said, overall spending trends are clearly important, and so let’s take a quick look at how much K-12 spending has increased in the U.S. over the past 25-30 years, using data from the School Finance Indicators Database (SFID). The SFID is an important resource for those who study and write about school finance, and so our brief examination of the spending trend also provides an opportunity for transparency: the stakeholders, policymakers, and journalists who rely on our work should know more about how we collect and prepare the data we use. “How much does the U.S. spend on schools?” may seem like a simple question, but proper measurement tends to complicate things.
The big issue when looking at spending trends is cost adjustment. Everyone agrees that it’s pointless to compare fiscal figures over time without adjusting for inflationary pressures. But choosing the correct measure of cost adjustment is critically important if you’re looking to produce useful estimates of spending trends (whether nationally or at the state or district levels).
Many who argue that schools have greatly increased spending use the Consumer Price Index (CPI) or similar indices to adjust their figures (for more discussion, see this article by Matt Barnum at Chalkbeat). These indices are typically used to adjust, for example, wages and salaries for inflation, since they account for changes in the prices of consumer goods and services that most people use their earnings to purchase. What this fails to account for in our present context is that the cost of education is largely driven by compensation: about four of every five dollars spent in schools is spent on salaries and benefits (NCES 2022). Because wages rise and fall differently than consumer goods, measures of inflation based on consumer goods will likely not capture the “true” changes in the cost of education.
Education costs also vary across space: it costs more to recruit and retain qualified staff in some parts of the country than others, if only because the cost of living varies. For our work, we need a way to account for these costs differences across both time and space. Only then can we make meaningful comparisons across all of our nation’s school districts.
After considering several options, we decided on the Comparable Wage Index (CWI). Developed by Dr. Lori Taylor, the CWI is based on a simple but important premise: the cost of hiring qualified school staff rises or falls relative to the costs of hiring similarly educated workers. The CWI (and its “extended” version, the ECWI) adjusts for differences in worker characteristics that affect wages, such as age and time worked, to arrive at an estimate of the overall differences in wage costs over time and space.
Why not use changes in teacher salaries instead? Because it may be that teacher salaries drop over time compared to other college-educated workers; if so, the quality of the teaching workforce may also decline. The ECWI sidesteps this issue by focusing on non-teachers: it more accurately estimates the cost of hiring a qualified teacher.
While the ECWI is the best available cost adjuster, it does have serious limitations for our work. Most importantly, while our SFID data run from 1993 to 2020, the CWI only indexes from 1997 to 2013. A newer version (called CWIFT), developed by Taylor and employing similar methods, is also available. Even these data, however, run only from 2015 to 2019, and there is also no simple way to bridge the two datasets so they form one consistent index across time.
These limitations have required us to be creative. We’ve extended the ECWI data both backwards and forwards in time using a regression-based imputation. We’ve also tried using the Employment Cost Index from the Bureau of Labor Statistics to extend ECWI; both methods yield similar results.
Now, let’s return to the original question of changes in K-12 spending over time. The graph below presents three separate trends in average per-pupil spending (the two adjusted trends are expressed in year 2000 dollars):
- Unadjusted spending (red line);
- Spending adjusted for the Consumer Price Index (green line); and
- Spending adjusted using the ECWI (blue line).
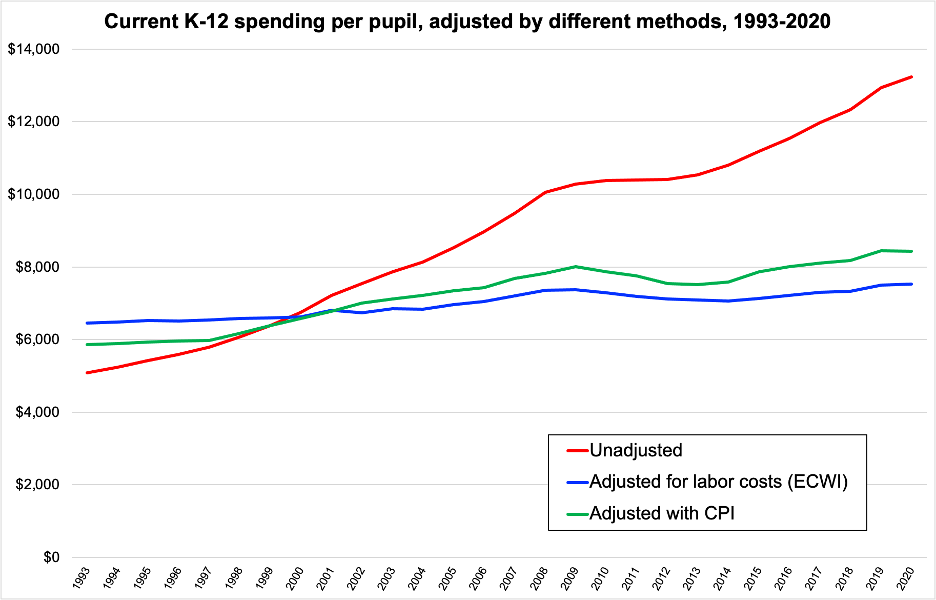
When adjusted for the commonly-used CPI, the increase in spending between 1993 and 2020 is roughly 45 percent. If, however, one adjusts using what we consider the more appropriate approach (the ECWI), spending increases about 17 percent.
In other words, across the entire U.S., per-pupil spending on K-12 public schools has increased, but more moderately than is generally assumed.
I would note, in closing, that this is ongoing work. In every iteration of the SFID, we assess the use of other adjusters. CWIFT only has five years of data; we’re not yet convinced that’s enough to justify extending it across our dataset through imputation or other means. We’ve also developed a state-level adjuster using data from the Census Bureau; while useful, we don’t believe we have developed a reliable way to extend it to the school district level (yet).
Our goal in each update of the SFID is to not only add an additional year of data, but to develop better methods to compare school finance data points across time. We’re very grateful to Dr. Taylor and others who labor to improve these measures even as we work to improve our indicators.