A Small But Meaningful Change In Florida's School Grades System
Beginning in the late 1990s, Florida became one of the first states to assign performance ratings to public schools. The purpose of these ratings, which are in the form of A-F grades, is to communicate to the public “how schools are performing relative to state standards.” For elementary and middle schools, the grades are based entirely on standardized testing results.
We have written extensively here about Florida’s school grading system (see here for just one example), and have used it to illustrate features that can be found in most other states’ school ratings. The primary issue is the heavy reliance that states place on how highly students score on tests, which tells you more about the students the schools serve than about how well they serve those students – i.e., it conflates school and student performance. Put simply, some schools exhibit lower absolute testing performance levels than do other schools, largely because their students enter performing at lower levels. As a result, schools in poorer neighborhoods tend to receive lower grades, even though many of these schools are very successful in helping their students make fast progress during their few short years of attendance.
Although virtually every states’ school rating system has this same basic structure to varying degrees, Florida’s system warrants special attention, as it was one of the first in the nation and has been widely touted and copied (as well as researched -- see our policy brief for a review of this evidence). It is also noteworthy because it contains a couple of interesting features, one of which exacerbates the aforementioned conflation of student and school performance in a largely unnoticed manner. But, this feature, discussed below, has just been changed by the Florida Department of Education (FLDOE). This correction merits discussion, as it may be a sign of improvement in how policymakers think about these systems.
Florida school grades are associated with student characteristics
First, let us quickly lay out the overall situation with Florida’s school grades, using data from the last year in which the grades were calculated using all measures (2013-14). For the purposes of simplicity, we will limit this quick analysis to elementary and middle schools, as the system is slightly different for high schools.
In 2013-2014, 2,666 of Florida’s elementary, middle and combined schools received grades. As you can see in the figure below (bottom bar, labeled “ALL”), just over half (52 percent) received a grade of A or B, another 41 percent were assigned a C or D, and the final seven percent received a failing grade.
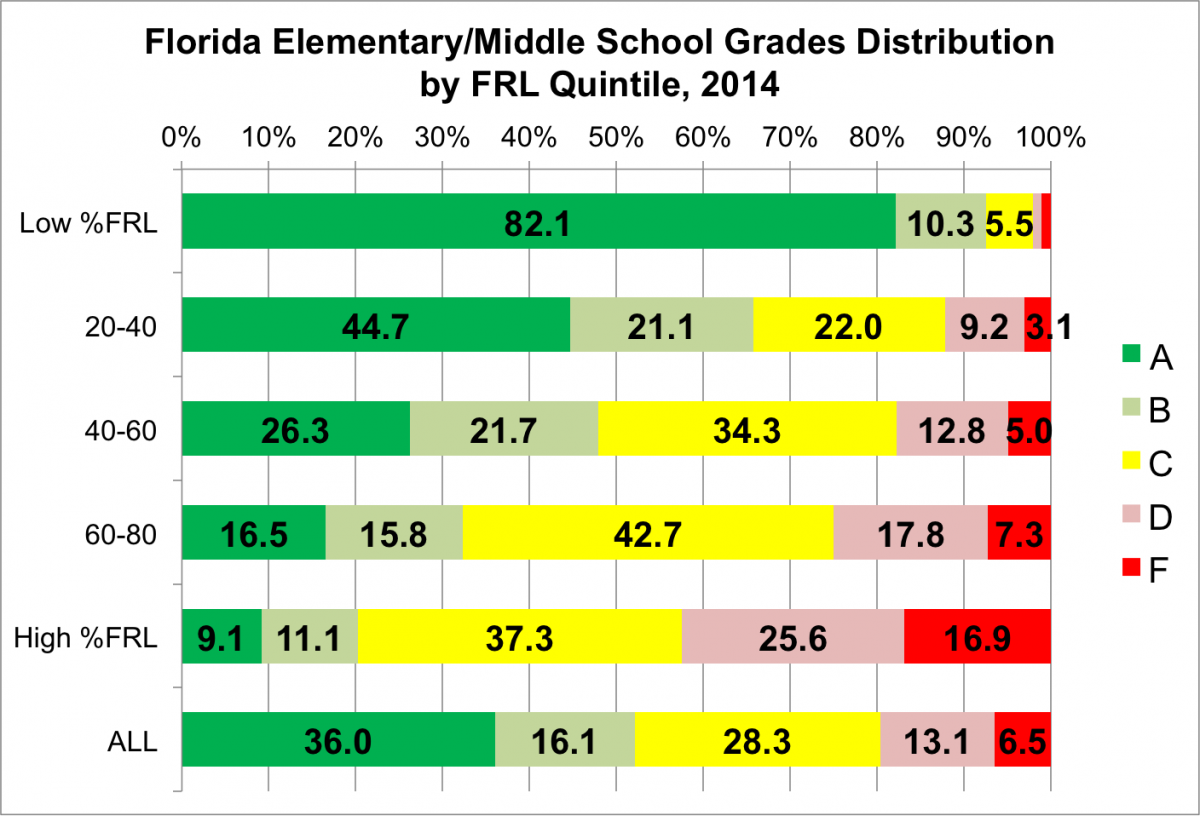
This figure also presents, in the first five bars, the distribution of school grades by the percentage of schools’ students eligible for free or reduced-price lunch (FRL), a rough proxy for student poverty. Schools are sorted into quintiles (the 20 percent with the lowest FRL rates, 20-40, 40-60, 60-80, and the quintile with the highest rates). This breakdown makes very clear the extremely strong relationship between FRL rates and school grades.
For example, well over 90 percent of schools with the lowest FRL rates (top bar) -- i.e., those serving the fewest disadvantaged students -- receive either an A (82.1 percent) or a B (10.3 percent) grade, whereas just over 20 percent of schools with the highest FRL rates are assigned one of those top grades. Conversely, 42.5 percent of the highest FRL schools receive D or F grades, compared to only about two percent of the schools in lowest FRL quintile. Out of the 174 schools receiving F grades in 2014, a full 72 percent of them – almost three out of four – were in one of the two highest FRL quintiles.
It is very clear that Florida’s school ratings are heavily associated with the proportion of schools’ students whose incomes are low enough to qualify them for federal lunch assistance.
Now, some of this relationship between income (as gauged by FRL eligibility) and school grades may reflect "real" differences - i.e., schools in poorer neighborhoods may be lower performing than their counterparts in more affluent areas, as the former, for example, tend to have trouble with teacher recruitment and retention and/or less adequate funding (see here for a discussion). In this case, however, the association is significantly -- one could argue mostly -- a function of the choice of measures and how they are used in Florida's system, according to which virtually every single school in affluent neighborhoods is an A/B school, while four out of five schools serving the highest proportion of impoverished students are C or worse.
Florida school grades are associated with student characteristics by design
Florida’s school grades consist of between eight and ten individual measures, each of which is expressed as a percentage. The eight “core” measures, which are worth a total of 800 possible points, might be divided into three general types of indicators:
- Status or absolute performance levels (how highly students score – i.e., proficiency rates);
- Overall “gains” (how much progress all students make);
- Subgroup “gains” (how much progress the lowest scoring students make).
Correlations between each of these individual measures and FRL eligibility are presented in the table below.
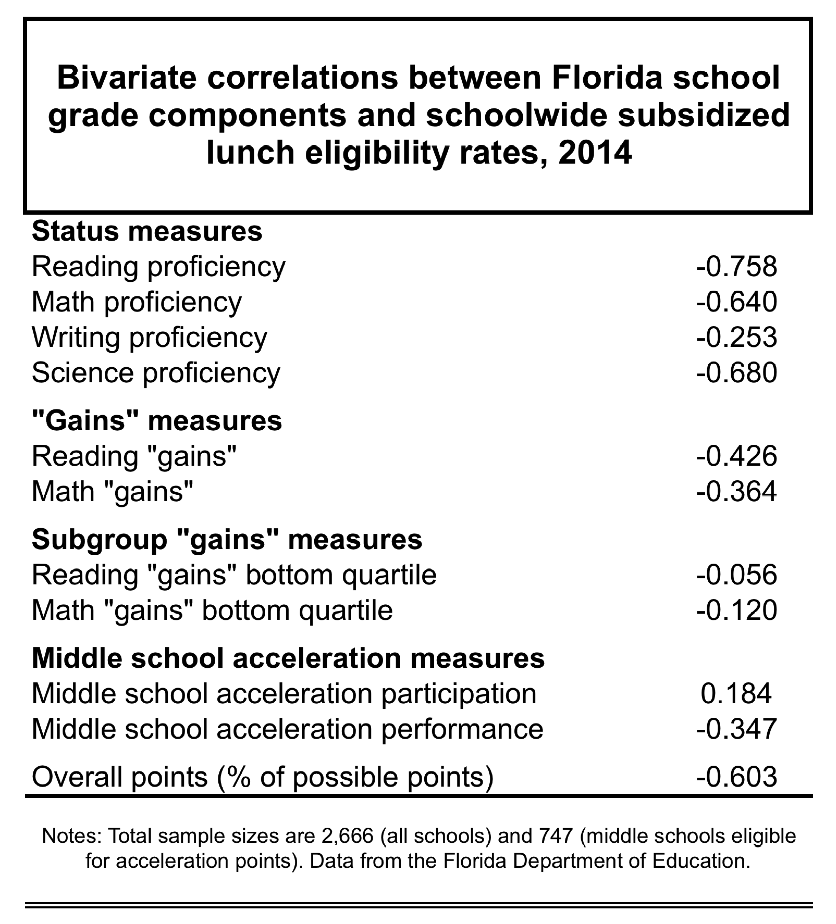
As you can see, with the sole exception of writing proficiency (an interesting exception), all of the status measures are quite strongly associated with this rough proxy for student income/poverty. That is, schools with higher FRL rates tend to exhibit lower proficiency rates. This is not at all surprising. It is due to the well-established fact that how highly students score on tests is predominantly a function of their backgrounds, rather than the quality of schooling they receive. Insofar as FRL eligibility is a rough proxy for that background, it exhibits a relationship with proficiency rates.
In this sense, then, one half of schools’ core point totals are based on measures of student rather than school performance – that is, they tell you much more about which students the schools serve than how well they serve those students. This goes a long way toward explaining the strong relationship between FRL eligibility and overall grades discussed in the previous section.
Growth measures, on the other hand, unlike their status counterparts, focus on how much progress students make over the course of the year, rather than how highly they score, and so these indicators, while still very limited and requiring cautious interpretation, are more useful for gauging schools’ actual impact on testing outcomes.
Florida’s “gains” measures are one particular type of growth indicator, and you can see in Table 2 that they are much less strongly correlated with FRL eligibility than the status indicators. Perceptive readers might notice that the overall “gains” measures are more strongly correlated with FRL than the subgroup “gains.” We will return to this issue shortly.
Florida’s “double counting” feature
We can now turn to the feature, mentioned above, that exacerbates the conflation of school and student performance. This feature pertains to how the “gains” measures are calculated, and it bears rather heavily on their interpretation. Specifically, in 2013-14, one of the criteria by which students could be coded as “making gains” was by scoring as proficient or better in the previous year and remaining proficient or better in the current year, without decreasing an achievement level.
To be clear, students could also be counted as making “gains” if they increased achievement levels or scored higher between years (i.e., if they actually made gains), but for students scoring proficient or better, they needed only to remain at that level in order to be considered by the system as having made “gains.”
This is, in essence, “double counting” with the math and reading status (proficiency) measures. Put differently, schools “get credit” for each proficient student in both the status measures and “gains” measures (so long as that student does not decrease a category). And students who are proficient or better in both years need not exhibit above average growth. In fact, their progress can be rather lackluster, so long as it does push them below the threshold of the category to which they were assigned the previous year.
As a consequence of this redundancy, the math and reading “gains” measures are rather strongly correlated with math and reading status (proficiency). You can see that in the second and final table, below, which is a correlation matrix of all eight “core” measures (i.e., correlations between all possible pairs of these measures). The relevant figures are shaded in blue.
There is a rather strong relationship between reading proficiency and reading “gains” (0.663), as well as between math proficiency and math “gains” (0.656). Some part of this relationship is a function of the fact, mentioned above, that schools serving more impoverished students may exhibit lower “growth” scores for “real” reasons. But it is, most likely, as much or more due to the fact that students who are proficient or better in both years are essentially “double counted.”
This decision on the part of Florida, which, in a sense, exempted proficient students from the “gains” measure, also contributes to the overall association between Florida’s school grades and FRL eligibility.
In other words, since schools serving more affluent students are likely to exhibit higher proficiency rates, and since those higher proficiency rates contribute to higher scores on the “gains” measure, more affluent schools do better on the “gains” indicators.
What would the measures look like if this “double counting” were removed from the system – i.e., if both proficient and non-proficient students were required to demonstrate above average growth in order to be counted as “making gains?” It is impossible to say with any precision using the publicly-available data, but we might get some idea by viewing the results for the subgroup “gains” measures. Since these indicators are limited to the lowest-scoring quartile in any given school, and since these low-scoring students are, on the whole, unlikely to be proficient or better, the “double counting” rule is far less of an issue when it comes to the two subgroup “gains” measures.
Going back up to the first table, it is clear that the two subgroup “gains” measures are only very weakly correlated with FRL status. Notice also, in the second table (cells shaded in yellow), that the two subgroup “gains” measures are also far less associated with the respective status measures. For instance, the relationship between math “gains” in the bottom quartile is far less strongly correlated with math proficiency than math “gains” among all students.
It is plausible to assume that this is because the subgroup “gains” measures do not “double count” proficient students, which in turn means that there is only a very weak relationship between FRL and subgroup “gains.”
As a consequence, it is very difficult to interpret overall “gains” as a growth indicator, since students need not exhibit growth to be coded as having made “gains.” This severely complicates the utility of this measure, and of the school grades in general.
A little bit of good news
Florida has just altered this rule. Under the new school grading system, effective in 2014-15, students who score at the "advanced" level (level five) in two consecutive years are still "double counted" as "making gains," no matter their rate of progress, but students scoring "proficient" (level four) in both years are only coded as "making gains" if their scale scores increase between years.
It is difficult to say how this change will affect the results presented above. Florida did not calculate testing “gains” in 2014-15, due to their having transitioned to the Common Core, so we cannot yet compare results under the new rule with those under the old (actually, the new rule may not have been possible using the old tests, as it requires scale scores that are comparable between years). The degree to which this change ends up leveling the playing field for schools will depend on how many proficient students are no longer coded as "making gains" despite flat or decreasing scale scores. Moreover, regardless of how this change pans out, the manner in which Florida defines "making gains," in my opinion, requires a lot more improvement.
All that said, this tiny rule change represents an improvement in the grades' calculation. It also shows that policymakers and other stakeholders in Florida are thinking about and leveraging the details of the system. Florida deserves credit for this correction.