Performance And Chance In New York's Competitive District Grant Program
New York State recently announced a new $75 million competitive grant program, which is part of its Race to the Top plan. In order to receive some of the money, districts must apply, and their applications receive a score between zero and 115. Almost a third of the points (35) are based on proposals for programs geared toward boosting student achievement, 10 points are based on need, and there are 20 possible points awarded for a description of how the proposal fits into districts’ budgets.
The remaining 50 points – almost half – of the application is based on “academic performance” over the prior year. Four measures are used to produce the 0-50 point score: One is the year-to-year change (between 2010 and 2011) in the district’s graduation rate, and the other three are changes in the state “performance index” in math, English Language Arts (ELA) and science. The “performance index” in these three subjects is calculated using a simple weighting formula that accounts for the proportion of students scoring at levels 2 (basic), 3 (proficient) and 4 (advanced).
The idea of using testing results as a criterion in the awarding of grants is to reward those districts that are performing well. Unfortunately, due to the choice of measures and how they are used, the 50 points will be biased and to no small extent based on chance.
In this case, the four measures used to calculate the 50 points for “academic performance” (math, ELA, science and the graduation rate) are combined using a weighting formula, one which appears quite arbitrary. The details of this formula are not important (it basically just says that math, ELA and graduation each count for 30 percent of the 50 points, while science counts for 10 percent).
For this grant program, the state will use results between 2010 and 2011. Unfortunately, index scores for 2011 are not yet available. In addition, in 2010, the state altered its math and ELA tests so as to make them more difficult and less predictable (see here). This means that we can use the 2010 data for science and graduation rates, but any comparison of 2010 math/ELA with previous years may be inappropriate due to the change in tests. In order to get an idea of how the system works, however, we can use data from 2007 through 2009 in math and ELA.
Let’s quickly review what we’re trying to do here. We’re trying to see whether changes in districts’ index scores (and graduation rates) actually measure performance in meaningful way. One limited but useful means of checking this out is to see whether the change over one year (say, 2007 to 2008) is similar the next year (2008 to 2009). As always, there is plenty of room for fluctuation between years. If, however, changes in the index are a decent measure of district performance, there should at least be moderate overall consistency over the years. If the changes are not consistent over time, then 50 of the 115 points in the grant application may to some extent be awarded based on chance (and/or on factors outside of schools’ control [though stability can also arise due to non-school factors, as discussed below]).
(Side note: We should bear in mind that more predictable tests may also appear to be more stable - i.e., this may be a conservative test of the volatility of year-to-year changes in the math and ELA indexes.)
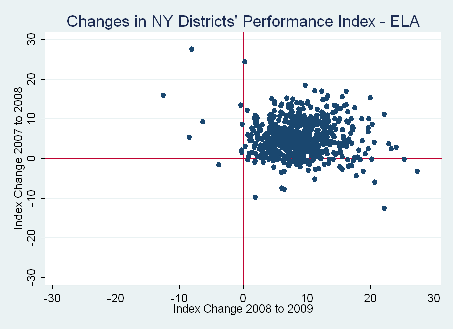
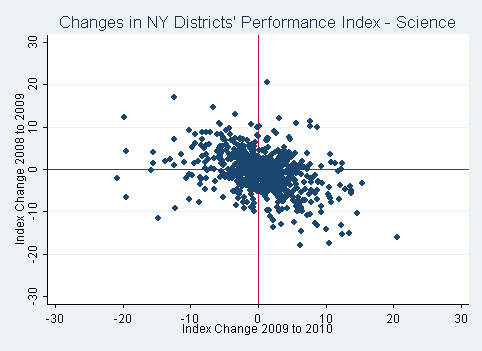
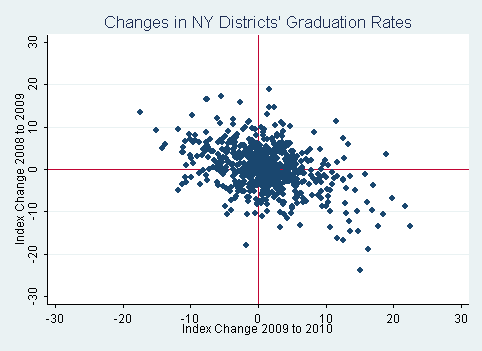
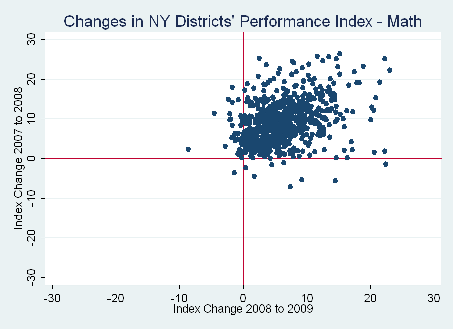
In the four scatterplots below – one for each subject –each dot represents a district (data are from the New York State Education Department). On the vertical axis is the change in its performance index – positive or negative – between 2007 and 2008 (or 2008 and 2009 for science and graduation). On the horizontal axis is the increase or decrease between 2008 and 2009 (2009 and 2010 for science and reading). The red lines going through the middle are the “zero change” lines, which means that a dot at the intersection of these lines had no change in its math index in either year-to-year transition. Let’s start with ELA.

Perhaps due to the state's highly predictable tests, virtually all districts increased their ELA index scores between 2007 and 2008, and again between 2008 and 2009. There is, however, no discernible relationship between the 2007-2008 and 2008-2009 changes. It is essentially random (the correlation coefficient is -0.078). Now, here's the plot for math.
The situation here is definitely better (the correlation coefficient is 0.321), but the relationship between these two changes is still less than impressive. To give an idea of this instability, among the districts that were in the top quartile (top 25 percent) in their 2007-2008 increase, about one-third were in the top quartile in terms of their 2008-2009 increase.
Finally, let's take a quick look at the plots for science and graduation rates (remember - these use data from 2008 to 2010).


The changes in the science performance index and graduate rates are again pretty much all over place (the correlations are -0.396 and -0.424, respectively). Changes between 2008 and 2009 do not help at all in predicting those between 2009 and 2010. In both cases, districts that increased in year one tended to decrease in year two, and vice-versa.
So, to the degree that year-to-year stability is an indication of accuracy, the four measures that NY will use to determine the 50 points for "academic performance" in its grant program appear to do a questionable job. Math is the only one that's even remotely reliable (though, again, the old tests may be partially responsible), and the relationship is still moderate at best. The other three are more or less random.*
All tests entail measurement error, and so there will always be imprecision in results in any given year (and over time), even with large samples. But the real problem here is less about the tests themselves than how they are being used.
As I’ve written about several times, measures of the change in raw scores or rates are even more error-prone than the actual scores and rates themselves, making them extremely problematic measures of school or district “performance." A great deal of the year-to-year variation in raw testing results is non-persistent – i.e., due to factors other than the schools/districts themselves (see this analysis of North Carolina test scores, which estimates that roughly three-quarters of the variation in grade-level score changes within the same school is transient).
Such volatility is due not only to the random error inherent in scores from any testing instrument, but also to the fact that unadjusted “progress” measures like those used in NY and other states don’t follow students over time and make no attempt to even partially account for demographic shifts using control variables. As a result, every year, in additional to “normal” student turnover (e.g., families who leave the district), a new cohort of students (usually third graders) enters the testing sample, while another cohort leaves the sample (in the case of math/ELA, eighth graders). An unstated assumption in this design is that, despite this churn, the “type” of tested students in each district doesn’t change much between years.
To some extent, this is probably true, especially in larger districts, which represent larger samples. Indeed, it’s important to note that the NYS performance indexes pool testing data across multiple grades (and across schools), while the grant formula also pools across subjects. These larger samples are less subject to variation in the "type" of students than single-school, single-grade comparisons in one subject (e.g., comparing one school’s fourth graders’ math scores in one year to its fourth graders’ scores the next year). But it’s still a matter of degree - at least some of the increases or decreases in the indexes are attributable to changes in the characteristics of the student population, especially in districts with fewer tested students.
Moreover, there are many factors besides testing error and sample variability influencing testing results that are outside of schools’ control (again, this is a bigger problem in smaller districts, since the samples are smaller). This might include peer dynamics, disruptive students or even things like bad weather or noisy construction on testing day. It’s also been shown, as one might expect, that increases in scores and rates vary by performance levels in the base year – for example, this Colorado analysis not only found high instability in year-to-year changes in an index similar to New York's, but also that schools with lower proficiency rates in the base year tended to increase more than those with higher starting rates.
Given all of these factors, it is unclear whether year-to-year changes in a district’s performance index actually reflect school-generated progress on the part of its students. New York is not alone here. For instance, California, which uses a very similar “performance index” at the school-level, also exhibits highly unstable year-to-year changes, as shown here. And, as discussed above, more rigorous analyses in additional states have reached the same conclusions (also see this Mathematica report). There is no perfect method here, and there's always some error involved, but several alternative approaches, including multiple years of data and more sophisticated methods that attempt to disentangle school- and non-school performance factors, would improve the quality of the measures.
In summary, then, if the changes between 2010 and 2011 (and beyond) exhibit roughly the same volatility as in the graphs above (as I believe will be the case), almost half of the points by which the state will judge grant applications will be biased by size and student characteristics, and will, to some degree, be a random draw. This is likely to dissuade many districts with great improvement ideas from applying, simply because 2011 happened to be a year in which their rates were flat or went down. And, among the districts that do apply, those with the best plans will still depend on the 50 points (out of 115) based on “performance."
Some will get lucky, others will not. I suppose that’s a competition of sorts, but not quite the kind that the state has in mind.
- Matt Di Carlo
*****
* Though not presented for the reasons stated above, I did run these simple analyses for math and ELA using the 2008-2010 data. The state's less predictable tests indeed seem to have had an effect in ELA - before the new test, virtually all districts increased between 2008 and 2009 (as in the graph above), while virtually all of them decreased between 2009 and 2010 (using the new tests). The results in math were a bit different - the 2008-2009 increases were followed by a fairly normal distribution of changes between 2009 and 2010 (about half of districts increased, while the other half decreased). In both cases, the relationship between the two changes is still highly volatile. Going forward, with the new tests, the best bet is that math/ELA index changes will follow the up-and-down pattern exhibited in the plot for the science index.

