What Do State And Local Governments Do?
Those who wish to dismantle public services in the U.S. seem to share a general belief – accepted, to some extent, even by people who generally support public sector spending – that government is a massive, incompetent blob. At the federal level, I have always found this somewhat strange, since around two-thirds of federal spending goes towards Social Security, Medicare/Medicaid and national defense, programs that are generally popular and widely regarded as successful.
Survey data indicate that people do trust state and local government more than they do federal government, but the level of confidence is still not particularly high. Americans also appear generally unwilling to pay higher taxes to preserve public services (except for education), and most accept that state and local government is too large and much of it is superfluous. But when people are asked about specific programs, they tend to respond favorably. This suggests, among other things, that people may have general perceptions of "government" without full knowledge of all the roles government plays.
So, I thought it might be useful to take a quick look at how public dollars actually are spent. After all, it’s our money, and it’s always good to keep track of how our elected officials are spending it.
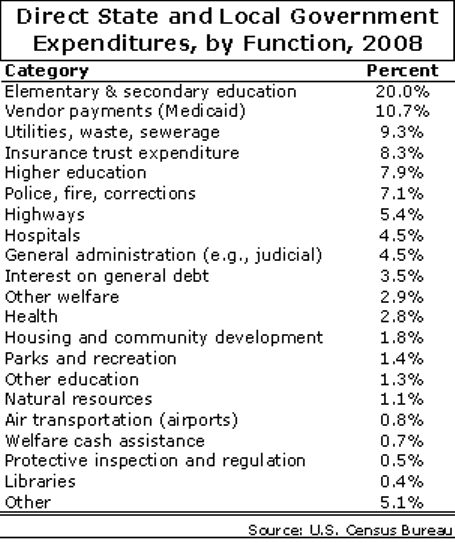
In the simple table below, I break down total state and local government direct expenditures (about $2.8 trillion) by function in FY 2008 (the latest year available). Keep in mind, of course, that some of the revenue for these programs comes from the federal level (about 20 percent or so, much of that for Medicaid), but the services are administered by states and localities. Also, remember that these are averages across all states, which do vary considerably. The data come from the U.S. Census Bureau.

Listening to our hyperbolic public debate on budgets, it may be easy for people to forget just how many things our state and local governments do.
The two largest categories – K-12 education and Medicaid (most of the “vendor payments” category) – get virtually all the attention, but together, they represent less than one-third of total spending (all figures in the table include capital spending). Medicaid is a means-tested program that provides health insurance for over 60 million Americans, half of them children. Not everybody supports the Medicaid program, but most do, and without this coverage the ranks of uninsured Americans would almost double.
Similarly, K-12 education, despite serious problems in some places, is generally considered to be a success among those it serves – that is, most Americans declare themselves to be satisfied with the quality of their own neighborhood public schools. (It bears mentioning, however, that people’s opinions of public schools as a whole – essentially, other people’s schools - are not as favorable.)
Beyond K-12 and Medicaid, a large chunk of spending goes towards “the basics” – the things we really take for granted, such as utilities/sewers, police/fire, and highways. Actually, as a group, those three general categories account for roughly as much spending as K-12 education (and, along with K-12 and Medicaid, the five categories represent about one-half of all state/local expenditures).
There are a few other small basic services – things that not many people would object to – such as public hospitals (4.5 percent), parks/recreation (1.4 percent), libraries and airports (both less than one percent).
Another eight percent goes towards public colleges and universities (including community colleges), which are generally well-regarded and respected (not to mention the fact that they provide among the only opportunities for lower-income and working-class kids to go to college).
As a whole, the programs mentioned above represent about two-thirds of all state and local spending.
Some of the types of programs that are most detested by "anti-government" folks, such as cash welfare (0.8 percent, mostly from federal TANF block grants) and inspection/regulation (0.5 percent), are among the smallest spending categories.
Another oft-discussed category is pensions, included in the “insurance trust expenditures” category (this category also includes workers compensation, unemployment benefits, and other social insurance programs). Public employee pensions, though they cover many millions of workers and are often portrayed as large fiscal monsters that consume a giant share of the public’s money, represent only about four percent of spending, on average.
Finally, many people (especially those of the fiscally conservative persuasion) also worry about growing state/local debt (interest on which represents about 3-4 percent of all spending), and some might object to the programs (besides Medicaid and TANF) that are included in the handful of social welfare categories, such as housing and community development (1.8 percent) and the “other welfare” residual category (2.9 percent).
Are all the programs in the table above perfectly designed and operated? Of course not. Is every dollar spent by state/local governments necessary? No. Nevertheless, when I look at this breakdown of government spending, most of what I see are vital and/or generally popular programs that serve an impressively wide variety of public needs. Many people may be wary of "government" as a concept, but they like the public services it provides.
So, when you hear people speak about our monstrous, catastrophically incompetent government and how we need to dismantle it, pull up this table and ask them to point out which specific programs they’re talking about. Then ask them to take a look at how much they cost, and to weigh that against the cost of not having them.
- Matt Di Carlo
