Who Pays For Education?
In education debates, especially these days, there is endless talk about spending – how to spend money, what programs to cut, and how to increase the bang-to-buck ratio. This is not surprising: In 2007-08 (the last year for which national U.S. Census data are available), we spent almost $600 billion. That’s quite a figure, and we all have an interest in spending that money wisely.
What is sometimes surprising is how little we hear about how we get that money. Of course, we all know that our tax dollars fund our public schools, and most of us know that state and local revenue is the primary source of this funding (about 90 percent; on average, about half state and half local). Less commonly-known, however, is who pays these bills – who bears the largest share of the tax burden, relative to their income? At the federal level, taxation is largely progressive, which means that, on the whole, higher-income families pay a larger percentage of their earned income to the federal government than lower-income families. This is, very simply, due to the fact that higher income brackets are taxed at higher rates.
But when it comes to state and local taxes, the picture is different. The poorest families pay far more of their income than the richest (i.e., taxes are regressive). In other words, the money that funds public education is a burden disproportionately borne by poor and middle-income Americans. And the lower your income, the more of it you pay. Given this situation, combined with a fiscal crisis that threatens to linger for several years, the best solution – raising revenue through a more equitable system – may be the only one not on the table.
Let’s take a very quick and easy look at how much families at different income levels are taxed, and what it means for education. Every few years, the Institute on Taxation and Economic Policy releases a wonderful report that breaks down these “tax burdens” for every state (and overall). States (and localities) vary widely in their tax policies and rates, but most generate the same structure of burden.
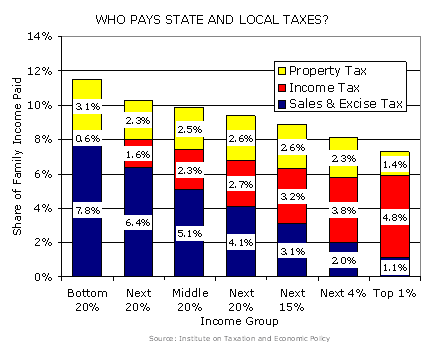
The graph below (which I recreated using data from the report) shows the percentage of family income that is paid to the three major types of state/local taxes – income, property, and sales – by how much families earn.

As you can see, the bottom 20 percent of earners (with an average income of $10,700) pays almost 12 percent of that income to state and local taxes, while the top one percent (average income $1.8 million) pays around seven percent – just over half the burden of the poorest. Of course, high-income families provide most of the total revenue - one person paying 6 percent of a million dollars generates more revenue than 20 people paying 12 percent of a very low income. But in terms of proportional burden - taxes as a percent of income - the structure favors the richest families. As you move across the groups, the pattern is clear and stable: The less you make, the more of that money you pay.
If you break it down by the type of tax, you can see why.
Like federal income taxes, state/local income taxes are progressive – the poorest families pay almost nothing, while the richest pay about five percent. In stark contrast, sales taxes are incredibly regressive – the poorest pay almost eight percent and the richest about one percent. The biggest reason for this is that lower-income families must spend most of their paychecks for living expenses (rather than save it), and so more of their money is “subject” to sales tax. Finally, property taxes are moderately regressive (though the rate is pretty stable until you get to the top one percent).
So, what does this mean? We’ve all heard the complaints about increases in education spending over the past 20-30 years. But over the past 2-3 years, the increases have been in federal spending (e.g., Race to the Top). Because of the recession, state and local spending on education has taken a hit in most places, and this is going to continue, perhaps get worse, over the next few years (K-12 education is usually among the last areas to be cut).
Should we increase efficiency in how we spend our public education money? Sure. Should we pour money into programs that aren’t working? Of course not. But look around. States all over the nation are cutting back in ways that hurt achievement, such as slashing pre-K programs. Troubled districts like Kansas City are closing schools in large numbers because they can’t afford them, thereby crowding more students into already-overcrowded schools. Skilled teachers, paraprofessionals, and other staff are being laid off because funds are short. And beyond education, the cuts to other programs and services have often been even more devastating. And all this despite billions in stimulus aid to states.
Think about this situation, and then consider how the top one percent, earning $2 million, pay state/local taxes at half the clip of the poorest, who earn $10,000. One might wonder why, in the midst of massive budget cuts, everybody talks about cutting programs or “streamlining” education spending, but almost nobody even mentions the possibility of increasing revenue by altering the fundamentally unfair system by which we fund our public services.
Changes to state and local tax structures – making them more equitable – would go a long way towards averting massive cuts in the future (which will inevitably cause disproportionate harm to the low-income families that bear the largest burden, recession or not). And in the longer-term, no matter what you think about education spending trends, the way we fund public education and other services is unfair and should change. The political environment may be hostile to this approach, but it has a friend in fairness and efficacy, and should at least be part of the discussion.
This is very interesting data and analysis. One implication, of course, is that as families become poorer AND districts lose money, we should expect worsening educational outcomes.