Public Apples, Private Oranges: A More Ripened Look
In a previous post, I criticized articles in the USA Today and elsewhere (all citing data from the conservative Cato Institute), which claimed that federal government workers earn almost twice as much as private sector employees (including salary and benefits). I argued that en masse comparisons of public and private sector workers don’t tell us much, since the jobs that comprise the two sectors are very different.
For a more useful comparison, we need to understand not only that most public sector workers are professionals, but also that they tend to be more experienced, and more quickly promoted, than the typical private sector employee. For example, a lead research scientist will earn more than his or her staff scientists, whether they are working in the public or the private sector. So, if public sector employees in a given occupation tend to be more experienced or have more authority or responsibilities, they will appear “overpaid” even though they are not.
So, how does the public/private wage gap look when we compare professionals in the two sectors by both occupation and experience/responsibilities?
In part to deal with issues like this, the Bureau of Labor Statistics (BLS) has a measure called “work level," which is sometimes used to classify jobs within the same occupation in terms of factors such as knowledge, supervision and complexity of work (for an excellent collection of state employees' compensation and working conditions, see AFT's new annual report). The work levels are a good (though imperfect) way to examine public/private wage gaps for occupations while accounting for factors such as experience that also affect wages. They go from 1 to 14, with higher levels indicating more responsibility, supervisory duties, complexity, etc.
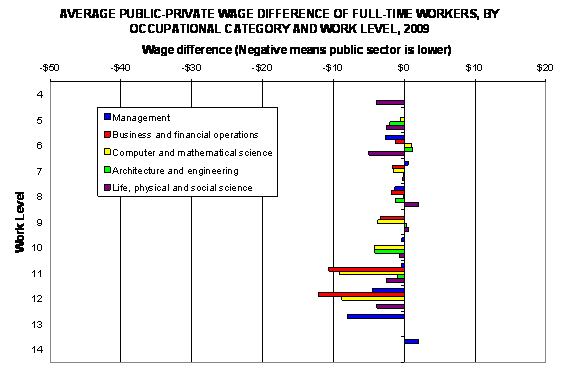
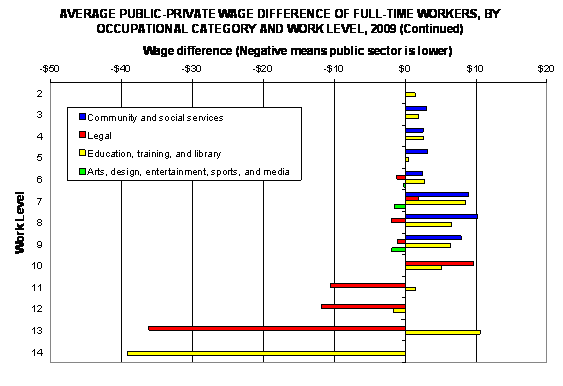
In the graphs below, I present the wage gap by occupational category and work level (negative numbers mean public sector employees earn less). The results are broken into two figures to make them easier to see. The data come from the BLS’ National Compensation Survey (NCS) for 2009.
I limit these comparisons to full-time workers in professional/technical occupational categories. To account for differences in the number of hours worked, I use BLS hourly wage estimates. These comparisons do not include benefits (on which data are not available), but the gap in benefits is likely to be far less than for other occupations, because professionals tend to get good benefits in both sectors.
Two other quick details about the graphs: First, the wages for public sector workers include only state and local government employees, because federal government workers are not included in the NCS data; second, estimates are not available for all levels and occupations because there aren’t enough workers for both sectors. Accordingly, some of the comparisons are blank, and there are no estimates at all for work level 1.

As the graphs make clear, for almost 70 percent of occupation/level combinations, private sector workers earn more than their state and local government counterparts.
Most of the gaps at the lower work levels (4-10) are less than $10 an hour, which is about $20,000 a year for a 40-hour work week. As one would expect, the differences are larger at the higher levels (11-14). In large part, this is because workers at the higher levels earn more.
The private sector “premium” is particularly large and persistent across all levels for “business and financial operations” employees and, to a somewhat lesser extent, for “computer and mathematical science” employees (programmers, software engineers) and “healthcare practitioners” (mostly nurses).
In contrast, there are two occupational groups (both in the second graph) that are clearly higher-paid in the public sector: “education, training, and library” (mostly teachers) and “community and social service” employees (social workers, counselors). These are two occupational groups with a very low presence in the private sector – together, they account for about 11 percent of all private sector professionals, compared with almost 60 percent of state and local government professionals (mostly teachers). These two occupational categories share one other interesting characteristic: They are the only two that are female-dominated.
These results show that most public employees would earn less in the private sector – but only because roughly half of them are teachers (private school teachers earn considerably less than public school teachers). But, when we compare jobs with similar levels of authority and responsibilities, most professional occupations demand higher pay in the private sector. Out of the 82 comparisons in the graphs above, only 26 are paid more in the public sector, and 18 of these are education or social service jobs.
The take-home message for professionals: Unless you’re a teacher or social worker, you’ll probably get paid more in the private sector. Remember that the next time you hear someone say that government workers are overpaid.

