Sample Size And Volatility In School Accountability Systems
It is generally well-known that sample size has an important effect on measurement and, therefore, incentives in test-based school accountability systems.
Within a given class or school, for example, there may be students who are sick on testing day, or get distracted by a noisy peer, or just have a bad day. Larger samples attenuate the degree to which unusual results among individual students (or classes) can influence results overall. In addition, schools draw their students from a population (e.g., a neighborhood). Even if the characteristics of the neighborhood from which the students come stay relatively stable, the pool of students entering the school (or tested sample) can vary substantially from one year to the next, particularly when that pool is small.
Classes and schools tend to be quite small, and test scores vary far more between- than within-student (i.e., over time). As a result, testing results often exhibit a great deal of nonpersistent variation (Kane and Staiger 2002). In other words, much of the differences in test scores between schools, and over time, is fleeting, and this problem is particularly pronounced in smaller schools. One very simple, though not original, way to illustrate this relationship is to compare the results for smaller and larger schools.
Schools vary widely in size. Some are large, with hundreds or thousands of tested students, while others serve just a few dozen students or less. As a rule, test results for smaller schools will be more volatile over time. That is, smaller schools will exhibit larger increases or decreases, positive or negative.
In the scatterplot below, each dot is a New York City school. The vertical axis is schools’ change in their overall proficiency rates (positive or negative) between 2013 and 2014. The horizontal axis is the number of tested students (i.e., sample size) at each school (averaged across both years).
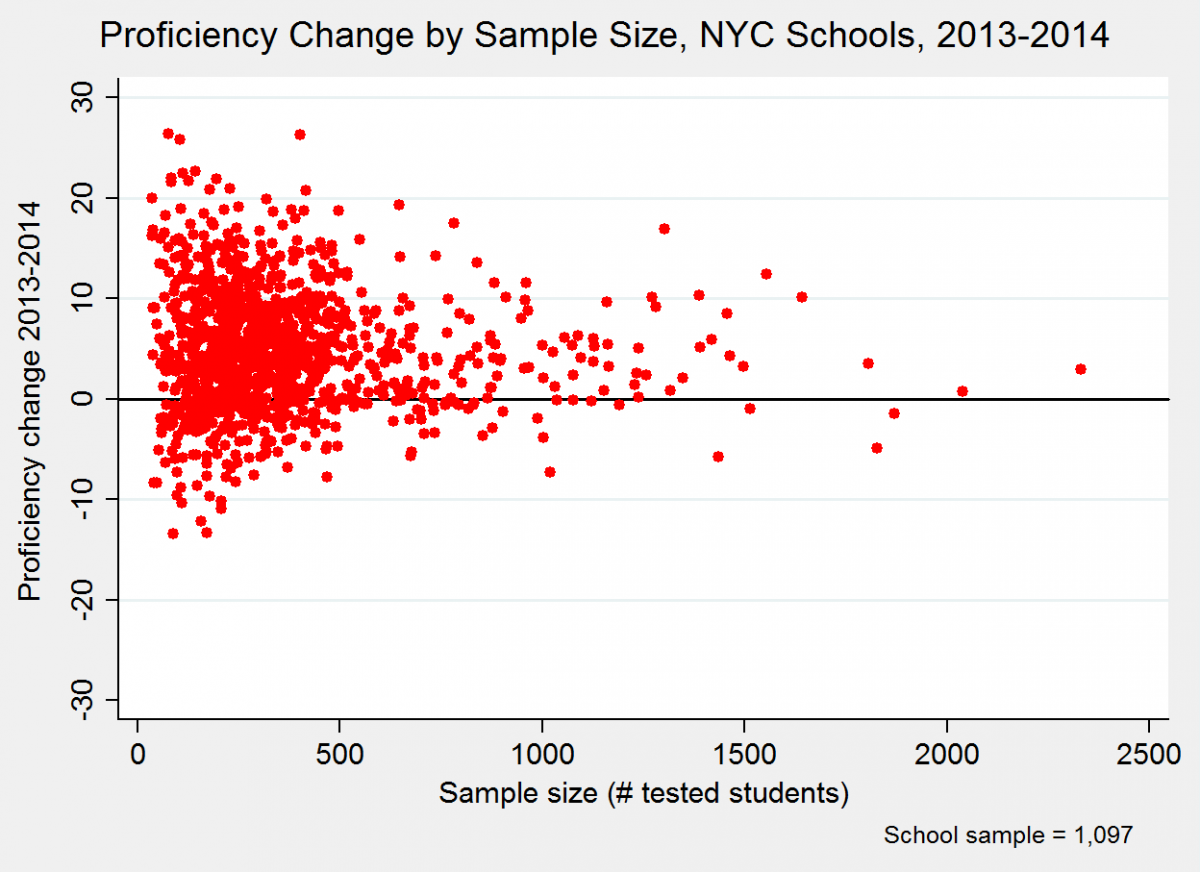
The “sideways cone” shape of the dots indicates that the changes among larger schools – i.e., the dots further to the right of the plot – are considerably more modest than those of smaller schools. Just to give a better idea of these differences, consider that roughly one in four schools in this sample have sample sizes of fewer than 200 students, while almost one in five (17 percent) of schools have samples of 500 or more students. The mean absolute change (positive or negative) for the former schools (fewer than 200 tested students) is 6.7 percentage points, which is almost 50 percent larger than the mean absolute change (4.5 percentage points) among the latter schools ( samples of 500 or more students).*
In other words, again, smaller schools exhibit much larger year-to-year changes, whether positive or negative, than larger schools. And this presumably is not because there is something about attending a smaller school that causes students’ measured performance to fluctuate more. It is because of their smaller samples.
This matters in accountability systems because it means that smaller schools are more likely to be rewarded or punished, not because they are any better or worse, but simply because their results are noisier. And the same goes for accountability systems that hold schools and districts accountable for performance among student subgroups – diverse schools would be less likely to punished or rewarded, because their subgroup-specific sample sizes are larger.**
Now, to be clear, the fact that schools are small, and thus tested samples are small, plagues all test-based accountability systems. There is no way to eliminate this problem – it is only a matter of degree.
That said, policymakers are not helpless here. In a future post, we will discuss some ways to address these issues, including policies that were implemented under NCLB.
*****
* These conclusions do not change appreciably if I split up the sample by school type - i.e., elementary, middle, high.
** This subgroup issue has emerged as a common one in current debates about whether to continue NCLB’s annual testing requirement. As Bruce Baker notes, however, this argument seems to under-acknowledge the fact that U.S. schools are highly segregated by ethnicity, income and other characteristics, and that, in a great many schools, subgroup samples are too small for high-stakes accountability no matter how many grades are tested.
The imprecision of test score
The imprecision of test score measures arises from two sources. The first is sampling variation, which is a particularly striking problem in elementary schools. With the average elementary school containing only sixty-eight students per grade level, the amount of variation stemming from the idiosyncrasies of the particular sample of students being tested is often large relative to the total amount of variation observed between schools. The second arises from one-time factors that are not sensitive to the size of the sample; for example, a dog barking in the playground on the day of the test, a severe flu season, a disruptive student in a class, or favorable chemistry between a group of students and their teacher. Both small samples and other one-time factors can add considerable volatility to test score measures. https://oxter.in