College Attainment In The U.S. And Around The World
A common talking point in circles in that college attainment in the U.S. used to be among the highest in the world, but is now ranked middling-to-low (the ranking cited is typically around 15th) among OECD nations. As is the case when people cite rankings on the PISA assessment, this is often meant to imply that the U.S. education system is failing and getting worse.*
The latter arguments are of course oversimplifications, given that college attendance and completion are complex phenomena that entail many factors, school and non-school. A full discussion of these issues is beyond the scope of this post - obviously, the causes and “value” of a postsecondary education vary within and between nations, and are subject to all the usual limitations inherent in international comparisons.
That said, let's just take a very quick. surface-level look at the latest OECD figures for college attainment (“tertiary education," meaning associate-level, bachelor's or advanced degree), which have recently been released for 2010.
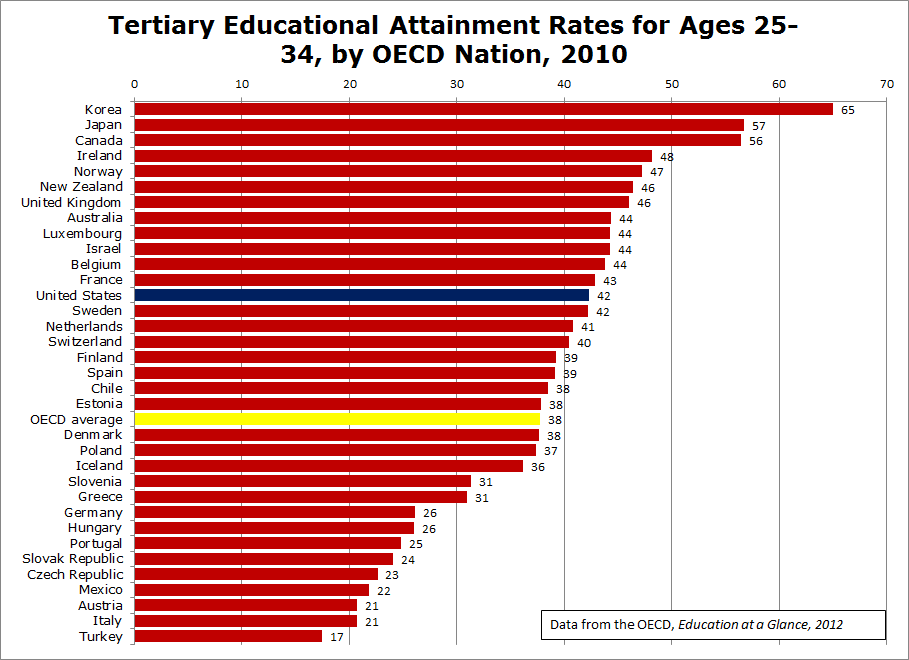
The graph below presents the nation-by-nation rates for the measure that is most commonly cited – the proportion of 25-34 year olds who have attained tertiary education. This younger age group is usually used for obvious reasons – because most people attend postsecondary schools when they’re younger, the 25-34 estimate best approximates the “current situation."
Among the 34 OECD nations included in the data, you can see that the U.S. is indeed ranked toward the middle (13th, or 14th if you include the handful of G20 nations also included in the OECD report, which are not shown in the graph).
But you can also see that there is a great deal of “bunching” of the rates among the nations ranked between 4th and 20th or so. For instance, the U.S. rate is only two percentage points lower than the four nations tied for 8th on the list. As always, one must be wary of simple rankings – nations with very different ranks have rates that are quite similar.
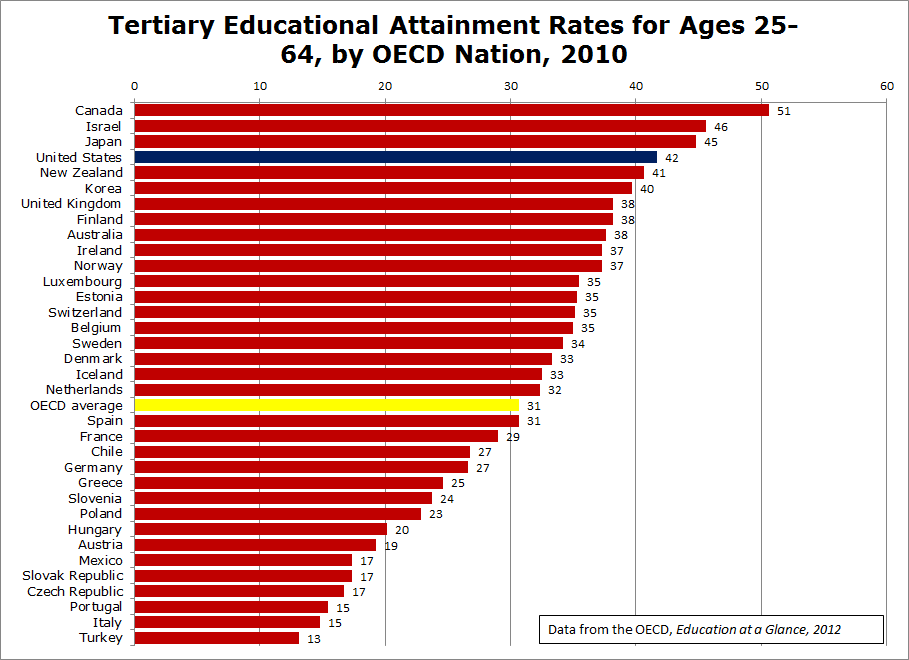
It might also be instructive to broaden the scope a bit, and look at the rates for 25-64 year olds. These are presented in the graph below.
There is, once again, a lot of “bunching," but the U.S. attainment rate is fourth highest in the OECD. The U.S. population overall remains among the most educated in the world (the rate is similar across all age groups - around 42 percent).
So, what has happened over the past decade or so is that U.S. attainment rates have been growing at a much slower pace than those of many (but not all) other nations. For example, between 2000 and 2010, the overall U.S. rate increased an average of 1.3 percentage points a year, compared with 3.7 percentage points for other OECD nations (see here).
In other words, the decline in relative U.S. standing is not because the situation in the U.S. getting worse per se, as is often implied, but rather because the rates elsewhere are increasing more quickly. This is still cause for concern, of course - the U.S. competes globally and domestic demand for college-educated workers seems to be outpacing supply - but it's always important to know where you stand and how you got there.
- Matt Di Carlo
*****
* See this exceedingly interesting recent paper on how international comparisons like this one may influence views of domestic education.


It's true that other countries are growing at a faster pace than the US, but these charts are misleading because they represent two different age groups. For older people, the US had the highest attainment rate, but among younger cohorts, the US has been slipping, not only relative to the rest of the world but also to previous generations within the US.
Interesting that Germany's college-completion rate is so low, well below the OECD average. Yet Germany has the most dynamic economy in Europe. What does that tell us?
Hi Bob,
You say that the charts are "misleading" because they "represent two different age groups." I'm not sure how that's so, given that they are specifically identified as such, but here are the rates for all age cohorts in 2010:
25-34: 42%
35-44: 43%
45-54: 40%
55-64: 41%
Here are the rates from 2001:
25-34: 39%
35-44: 38%
45-54: 40%
55-64: 31%
(Cite for 2001: http://www.keepeek.com/Digital-Asset-Management/oecd/education/educatio…)
Thanks for the comment.
MD